
Mass spectrometry
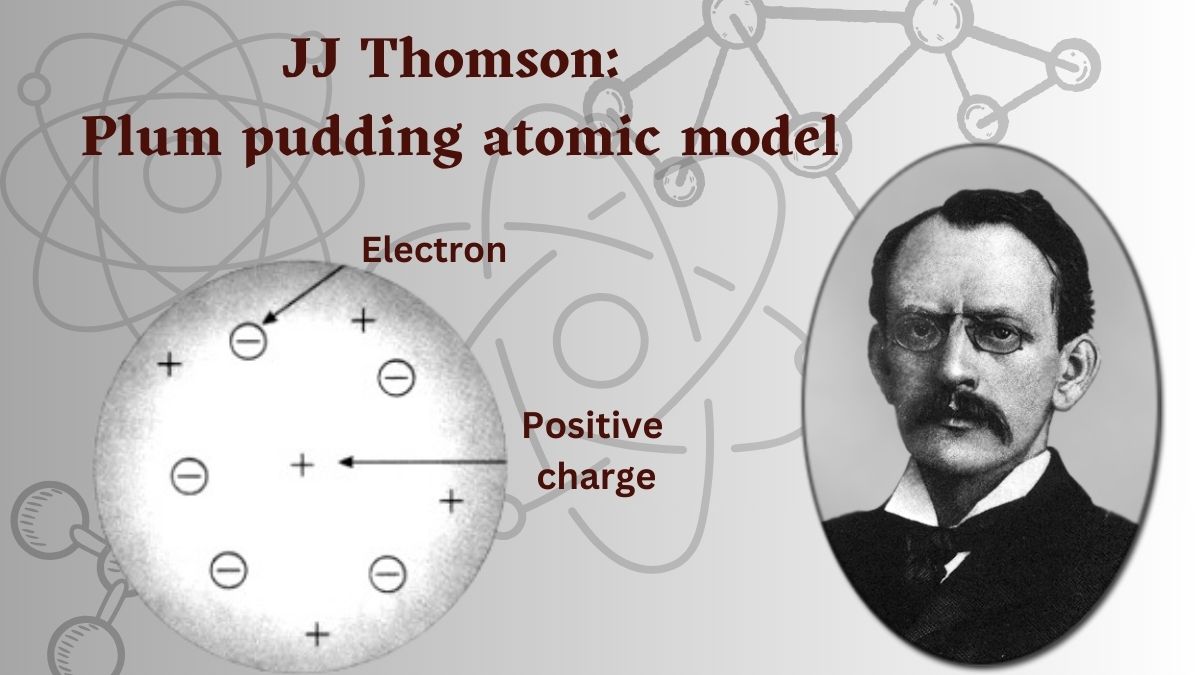
Atoms are not indivisible, for negatively electrified particles can be torn from them by the action of electrical forces.
— Sir J.J. Thomson
LC-MS system
I. | LC (Liquid Chromatography) part
-
LC
-
HPLC
- HPLC User Maintenance & Troubleshooting (PDF), Agilent
- HPLC Columns
- Nexera UHPLC/HPLC System, Shimadzu Corporation
- Vanquish UHPLC FLEX [Thermo Fisher]; Vanquish Neo nanoLC[VN-S10-A-01, Thermo Fisher; for nano-flow]
- ACQUITY UPLC, Waters
- EASY-nLC 1200:
- Ultimate 3000 RSLCnano System, Thermo Scientific, for nanoliters flow rates
- UltiMate 3000 RS HPLC systems, for microliters flow rates
- Reversed-Phase Chromatography (RPLC): Reversed-Phase Chromatography (RPC) is the standard technique for separating peptides in mass spectrometry-based proteomics because it separates compounds based on their hydrophobicity using a nonpolar stationary phase and a polar mobile phase.
II. | MS (Mass spectrometry) part
- Orbitrap based:
- Review article: Evolution of Orbitrap Mass Spectrometry Instrumentation [PDF | PMID: 26161972 | DOI Link]
- Q Exactive-HF
- Q Exactive HF-X
- Q Exactive-fusion
- Orbitrap Exploris 240:
- Orbitrap Exploris 480:
- Orbitrap Astral: [Brochure, PDF]
“ The Orbitrap Astral mass spectrometer comes with extraordinary gains in both sensitivity and scan speed, filling it with proteomic possibilities. Our very first full-proteome datasets using TMT were already remarkably deeper (>11,000 proteins) and were acquired in only two-thirds the normal analysis time.”
— Steven P. Gygi, Ph.D., Harvard Medical School
- Hybrid system:
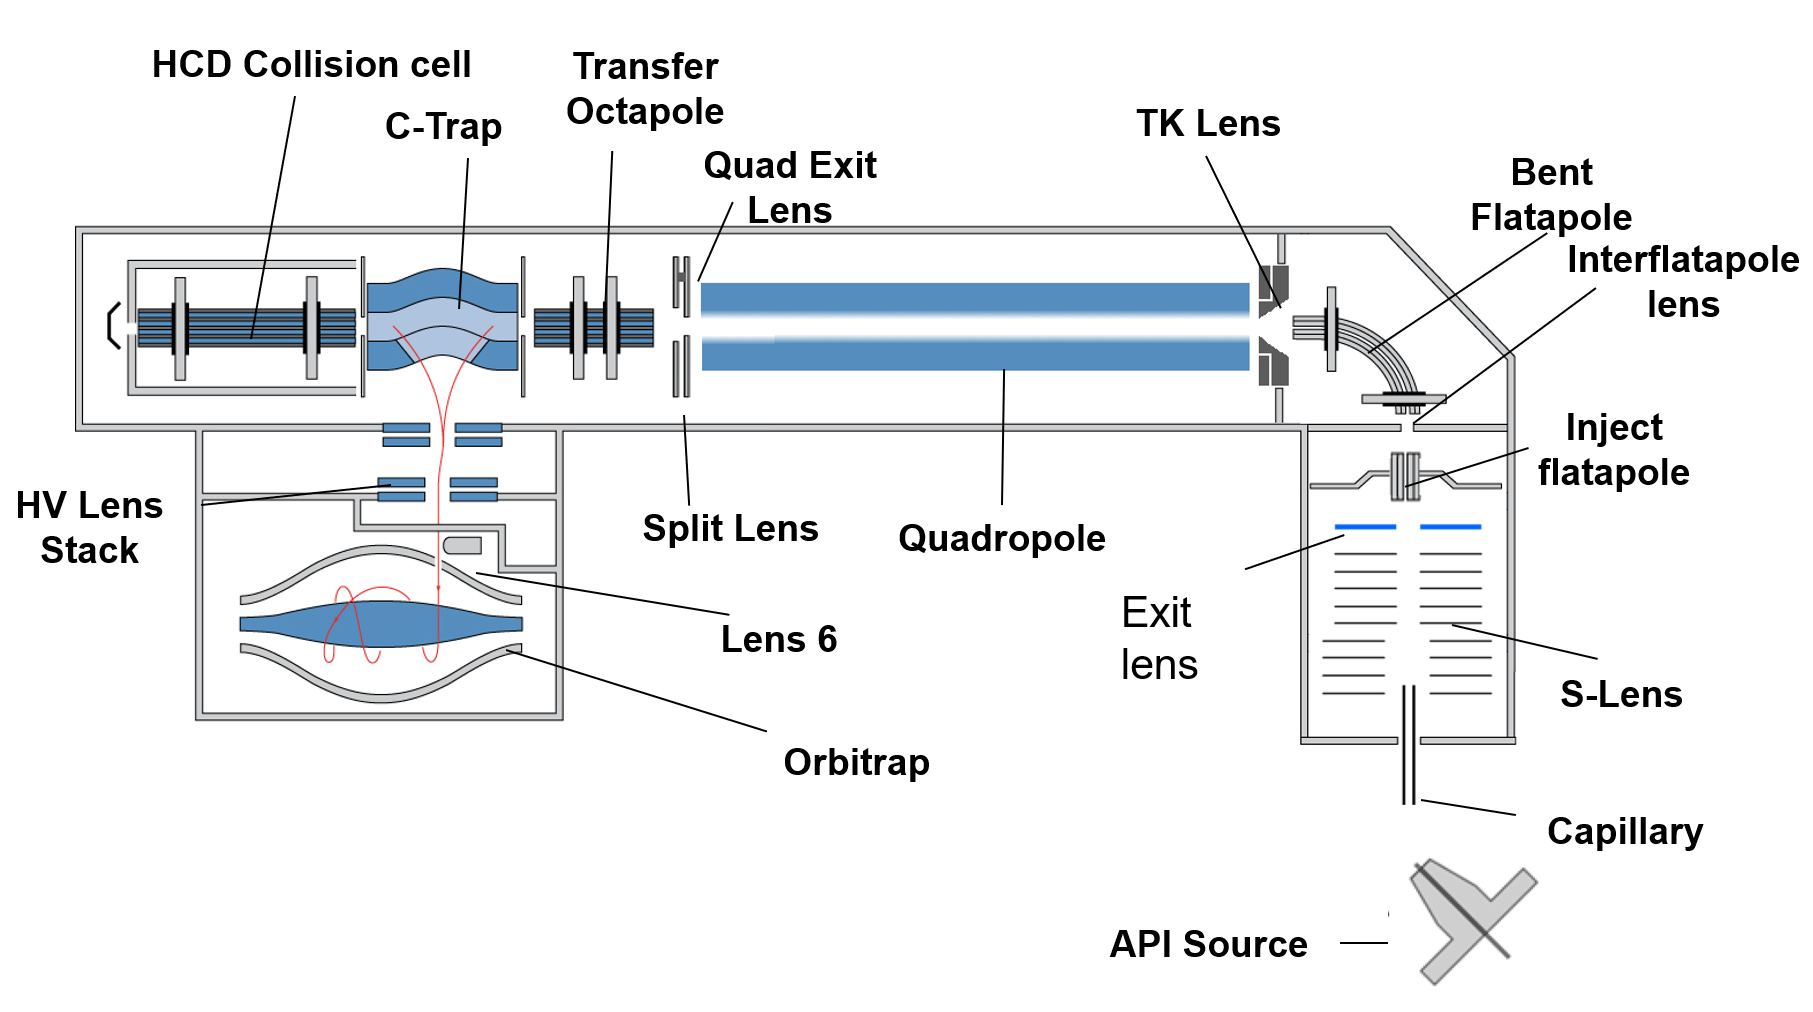
- Orbitrap Fusion Lumos Tribrid: Orbitrap Fusion Lumos Tribrid mass spectrometr (Thermo Scientific) is mass spectrometer combines quadrupole, ion traps and orbitrap mass analyzer. According the mentioned combination, Thermo Scientific provider called the instrument tribrid. This system incorporates the brightest ion source, a segmented quadrupole mass filter with improved selectivity and ion transmission, Advanced Vacuum Technology for improved ion transmission to the Orbitrap mass analyzer. The instrument provide the possibility of well-established ionizations as ESI, nanoESI, APCI and APPI and fragmentation CID, HCD and ETD. The instrument provides 1,000,000 FWHM ultra-high resolution for improved structural elucidation and quantitation of isobaric compounds. The instrument can be connected to two HPLC systems; UltiMate 3000 RSLCnano and UltiMate 3000 RS HPLC systems (Thermo Scientific) for HPLC in nanoliters and microliters flow rates, respectively.
- Orbitrap™ IQ-X™ Tribrid™: The Orbitrap™ IQ-X™ Tribrid™ mass spectrometer (Thermo Scientific) combines quadrupole technology, linear ion trap, and Orbitrap mass analyzer to provide the most comprehensive MSn data per sample. It features a new Auto-Ready ion source for operator-free calibration in combination with Thermo Scientific™ EASY-IC™ (internal calibration). The instrument offers flexible fragmentation options for determining the structure of lipids, metabolites, and other small molecules using collision-induced dissociation (CID), high-energy collisional dissociation (HCD), and ultraviolet photodissociation (UVPD). It provides ultra-high resolution of at least 500,000 FWHM for improved analysis of unknown compounds and isotope detection. The instrument is connected to a Thermo Scientific Vanquish UHPLC system and utilizes a TriPlus RTC autosampler and liquid sample handling system. [ThermoFisher |]
- Orbitrap Eclipse™ Tribrid™: The Orbitrap Eclipse Tribrid mass spectrometer was developed with the capability to extract unrivaled quantitative data from ultra-low-level samples, including from individual cells.[ThermoFisher brochure | Single cell proteomics]
- Triple Quadrupole based:
- TSQ Quantum Access MAX [Thermo]
- TSQ Altis [Thermo Brochure | Hardware Manual | ]
- SCIEX QTRAP5500+: [SCIEX | System User Guide, PDF]
- SCIEX QTRAP6500+: [SCIEX | Operational Guide, PDF]
- SCIEX QTRAP7500:
Vendor companies
MALDI system
-
MALDI
- Rapiflex, MALDI-TOF/TOF, Bruker: rapifleX® is the most advanced MALDI-TOF imaging system on the market and was designed specifically for MALDI Imaging applications. [Product brochure, PDF]
- TimsTOF-Pro, Bruker: powered by the Trapped Ion Mobility Spectrometry(TIMS) [[]]
- TimsTOF Pro 2, Bruker: powered by the latest Parallel Accumulation SErial Fragmentation (PASEF®) [Introduction Link | PDF]
Beyond its high sensitivity, the timsTOF Pro instrument stands out for its capacity to resolve positional phosphorylation isomers in the gas phase, thereby providing researchers with more comprehensive insight into signaling pathways.
In particular, the speed and sensitivity of TimsTOF Pro enable us to see more small peptides from limited amounts of starting material, which we expect to be particularly valuable for new discovery. - Matrixs: [DHB | 1-5-DAN | ]
-
AP/MALDI
- MassTech
- TransMIT
Vendor companies
Proteomics
-
Upstream: Protocol for peptide mixture cleanup
- Peptide extraction buffer (PXB): [ACN, 50% (v/v) | TFA, 0.1% (v/v) | ddH2O 49.9% (v/v)]
- Peptide drying and resuspend: [SpeedVac, Thermo | 0.1% TFA]
- Purification of peptides: StageTips
- Rappsilber, J., Mann, M. & Ishihama, Y. Protocol for micro-purification, enrichment, pre-fractionation and storage of peptides for proteomics using StageTips. Nat Protocol 2, 1896–1906 (2007). [DOI link]
-
Downstream: Bruker Proteomics solution
- Instrumentation
- nanoElute (Bruker Daltonics)
- 25cm * 75um * 1.6um C18 column(IonOpticks, Australia)
- Column oven(Sonation)
- captiveSpray Ion source(Bruker)
- timsTOF Pro(Bruker Daltonics)
- Method
- PASEF
- dia-PASEF
- prm-PASEF
- Instrumentation
-
Downstream: Thermo Fisher Proteomics solution
-
ref. parameters on LC-MS (Ultimate 3000-nanoLC + QE HF-X):
- Dionex Ultimate 3000 nanoLC system:
- Autosampler: Thermo Finnigan HPLC Micro AS Autosampler [Hardware manual, PDF | Video demo]
- Column: C18 analytical LC column (2 μm, 100 Å, 75 μm i.d. × 500 mm, nanoViper, Thermo Scientific, 164942); Acclaim PepMap100 column (5 μm, 5 mm by 300 μm internal diameter (ID) [Thermo Fisher Scientific]); Acclaim PepMap100 analytical column (2 μm, 50 cm by 75 μm ID, Thermo Fisher Scientific)
- mobile phase A: 0.1% formic acid in water; mobile phase B: 0.1% formic acid in ACN.
- gradient elution: 2% B at 0–15 min, 30% B at 81 min, 35% B at 85 min, 40% B at 87 min, 60% B at 95 min, 80% B at 96–107 min and 2% B at 108–120 min.
- Flow rate: 600 nl/min at 0–13.5 min and 250 nl/min at 13.5–120 min.
- Q Exactive HF-X (Data-Dependent Acquisition, DDA): Full-scan MS
- m/z range of 300-1650, resolution of 60,000, AGC target = 3e6;
- top 15 for HCD, resolution of 15,000, collision energy of 30 eV, AGC target = 1e5;
- dynamic exclusion time: 30 s
- Orbitrap Fusion Lumos (DDA): m/z 350 to 2000 in the MS mode
- HCD: ions of m/z 100–2000.
- Dionex Ultimate 3000 nanoLC system:
-
ref. parameters on LC-MS (Vanquish Neo nanoLC + QE plus/Exploris 480):
- Vanquish Neo nanoLC:
- Acclaim PepMap RSLC (75 μm × 25 cm); Trap column: Acclaim PepMap 100(75 μm × 2 cm)
- mobile phase A: H2O with 0.1% formic acid; mobile phase B: 80/20 (%, v/v) ACN/H2O with 0.1% formic acid.
- gradient elution: 85 mins
- injection volumn: 2 μL
- QE plus (Full-MS/dd-MS2 DDA):
- Range = 250-1800 m/z, MS1 resolution = 70,000, AGC target = 3e6;
- top 15 for HCD, resolution of 17,500, collision energy of 28 eV;
- dynamic exclusion time: 25 s
- Orbitrap Exploris 480: [PDF]
- Range = 375-1200 m/z, MS1 resolution = 60,000, AGC target = 3e6;
- resolution of 15,000, Collision energy of 26 eV;
- dynamic exclusion time: [25s | 30s | 45s | 50s]
- Vanquish Neo nanoLC:
-
Database search:
-
Downstream: Sample tagging system
- Tandem Mass Tag (TMT) Systems: All mass tagging reagents within a label reagent set have the same nominal mass (i.e., they are isobaric) and chemical structure, composed of a reactive group, a spacer arm (mass normalizer), and a mass reporter.
- TMT: 2- to 11-plex
- TMTpro: 16- to 35-plex
- SILAC: SILAC involves labeling protein samples by growing cells in media containing an isotopically heavy form of an amino acid and the naturally occurring light form.
- iTRAQ (Isobaric Tags for Relative and Absolute Quantitation): iTRAQ utilizes isobaric reagents to label the primary amines of peptides and proteins. The iTRAQ reagents usually consist of an N-methyl piperazine reporter group, a balance group, and an N-hydroxy succinimide ester group that is reactive with the primary amines of peptides. The balance groups present in each of the iTRAQ reagents function to make the labeled peptides from each sample isobaric and the quantification is facilitated through analysis of reporter groups that are generated upon fragmentation in the mass spectrometer.
- 4-plex
- 8-plex
- Tandem Mass Tag (TMT) Systems: All mass tagging reagents within a label reagent set have the same nominal mass (i.e., they are isobaric) and chemical structure, composed of a reactive group, a spacer arm (mass normalizer), and a mass reporter.
-
Downstream: Data Processing
- MaxQuant
- MaxQuant DDA Basics 1 | Kyriakidou Pelagia: Frontal lecture on how MaxQuant analyses spectra. [Download mp4 video]
- MaxQuant DDA Basics 2 | Kyriakidou Pelagia: Frontal lecture on how Andromeda-search identifies peptides. [Download mp4 video]
- MaxQuant DDA Basics 3 | Kyriakidou Pelagia: Frontal lecture about which are the steps of a full MaxQuant run and how protein groups are generated. [Download mp4 video]
- MaxQuant DDA Tutorial 1 | Dmitry Alexeev: Tutorial on how to run MaxQuant to analyze DDA data. [Download mp4 video]
- MaxQuant DDA Tutorial 2 | Dmitry Alexeev: Tutorial on how to run MaxQuant in Linux, using the command line. [Download mp4 video] - MaxDIA 1 | Jürgen Cox: Frontal lecture on how MaxQuant and Andromeda analyze DIA data. [Download mp4 video]
- MaxDIA 2 & new features | Jürgen Cox: Frontal lecture on how MaxDIA algorithm has been improved. [Download mp4 video]
- MaxQuant DIA Tutorial | Shamil Urazbakhtin: Tutorial on how to change parameters in MaxQuant in order to analyze DIA data. [Download mp4 video]
- MaxQuant Viewer | Shamil Urazbakhtin: Tutorial on how to use MaxQuant viewer: tool to visualize spectra, ions and peptides. [Download mp4 video]
- Andromeda: A Peptide Search Engine Integrated into the MaxQuant Environment [PMID: 21254760]
- MaxDIA:MaxDIA is a software platform for analyzing data-independent acquisition (DIA) proteomics data within the MaxQuant software environment. [PMID: 34239088]
- Perseus
- Perseus Introduction | Juan Luis Restrepo-López: Frontal lecture about Perseus: which statistical analyses can be done with it and how to. [Download mp4 video]
- Perseus Basic Tutorial | Juan Luis Restrepo-López: Data cleaning, pre-processing and data visualization. [Download mp4 video]
- Perseus Intermediate Tutorial | Juan Luis Restrepo-López: Statistical analyses, results interpretation and visualization. [Download mp4 video]
- Spectronaut: Powerful software package for comprehensive analysis of data-independent acquisition (DIA) proteomics experiments. [Software manual, PDF]
- Skyline
- ProteinMetrics
- PEAKS Studio, PEAKS Online
- MaxQuant
Post-translational Modifications
Proteomics analysis softwares
-
mMass: The mMass program we use to open spectra in .msd format has been discontinued and is no longer supported. The program website http://mmass.org/ is inactive and will soon be completely removed. The latest version of mMass can be downloaded from https://github.com/xxao/mMass-Dist.
-
Mass Spectrum Interpreter: The Interpreter finds possible structural origins of peaks in a mass spectrum and provides formula and isotopic processing utilities. It operates in conjunction with the MS Search Program. Version 2 replaces all earlier versions and was described in a poster in the meeting of the International Mass Spectrometry Society, Edinburgh, UK, 2003, “An Automated Method for Verifying Structure-Spectral Consistency Based on Ion Thermochemistry” (Download ppt).
-
OpenMS: OpenMS 2.0, a robust, open-source, cross-platform software specifically designed for the flexible and reproducible analysis of high-throughput MS data. The extensible OpenMS software implements common mass spectrometric data processing tasks through a well-defined application programming interface in C++ and Python and through standardized open data formats. OpenMS additionally provides a set of 185 tools and ready-made workflows for common mass spectrometric data processing tasks, which enable users to perform complex quantitative mass spectrometric analyses with ease.
-
MSclassifR: MSclassifR is an R package that has been specifically designed to improve the classification of mass spectra obtained from MALDI-TOF mass spectrometry. It offers a comprehensive range of functions that are focused on processing mass spectra, identifying discriminant m/z values, and making accurate predictions. The package introduces innovative algorithms for selecting discriminating m/z values and making predictions.
-
MSTools: The open access EPFL MStoolbox is a compilation of all these tools that allow the analysis of High Resolution Mass Spectra directly from your web browser. This webpage provides guidelines and explanations for each tool and is targeted for both beginners and advanced MS users. The EPFL MStoolbox could be particularly useful for anyone working in the field of Mass Spectrometry but does not have access to commercial software for the data treatment.
-
ProteoWizard: ProteoWizard provides a set of open-source, cross-platform software libraries and tools (e.g. msconvert, Skyline, IDPicker, SeeMS) that facilitate proteomics data analysis. The libraries enable rapid tool creation by providing a robust, pluggable development framework that simplifies and unifies data file access, and performs standard chemistry and LCMS dataset computations.
Proteomics resources
- MiGENet: MiGENet allows extraction of spatial information on the connectivity and the molecular mechanisms governing mitochondrial gene expression.
Ref. Labs
-
Bottom-up proteomics
- The analysis focuses primarily on the identification of proteins, their post-translational modifications, and/or the quantification of proteins, either using methods based on isotopic labelling or label-free methods. The procedure involves proteolytic digestion of proteins and the analysis of the resulting peptides. The analysis itself is based on liquid chromatography coupled with high-resolution mass spectrometric analysis of peptides. This allows for sensitive and reliable identification/quantification of proteins or their modifications in the analyzed sample. Protein samples in various forms can be analyzed. We can analyze dried protein samples, as well as proteins separated in SDS-PAGE gel or proteins dissolved in various buffers.
- Instruments: UltiMate 3000 RSLCnano + Orbitrap Fusion™ Lumos™
-
Top-down proteomic analysis
-
Intact mass: Analysis of the intact mass of proteins or nucleic acids under denaturing conditions. It serves as a more precise equivalent to SDS-PAGE with a mass determination accuracy up to 1 Da. It is possible to analyze both pure proteins and nucleic acids, as well as simpler mixtures (up to, for example, 10-20 pure proteins). More complex mixtures, or a very heterogeneous mixture of different proteoforms of one protein, can be problematic; however, it is possible to perform LC-MS separation of the sample before analysis. It is also possible to analyze larger proteins, such as antibodies. We also provide the calculation of Drug-to-Antibody Ratio (DAR) for antibody-drug conjugates as a service.
-
Native MS: Native mass spectrometry allows for the study of non-covalent protein-protein or protein-ligand complexes under biologically relevant “native” conditions. The analysis is performed using very gentle ionization, which allows the entire non-covalent complex to be transferred from solution to the mass spectrometer detector.
-
- Steven Gygi Lab, Harvard Medical School
- BioPlex Interactomes: The biophysical interactions of ORFeome-based complexes (BioPlex) network is the result of creating thousands of cell lines with each expressing a tagged version of a protein from the ORFeome collection.
- Taplin Mass Spectrometry Facility, HMS: The Taplin Biological Mass Spectrometry Facility opened in February 2001 as a core facility for the analysis of proteins and peptides by mass spectrometry.
- Thermo Fisher Center for Multiplexed Proteomics (TCMP@HMS): a multiplex quantitative proteomic analysis core which started its operation in 2014 under the direction of Professor Steven P. Gygi.
- Instruments: EASY-nLC™ 1200 System + Orbitrap Eclipse™ Tribrid™ Mass Spectrometer
- Lingjun Li Lab, University of Wisconsin Madison
Metabolomics
- Upstream: Protocol for metabolite extraction
- Protocol for metabolite extraction
- From Plasma for HILIC LC-MS: PDF
- From adherent cell line: PDF
- From tissue/organ for HILIC LC-MS: PDF
- Purification of metabolites from brain tissue: Brain tissue samples were collected in 1.5ml Eppendorf tubes and then 900 µl of ice-cold methanol/80% water (vol/vol) was added. The samples were shaken at 120 rpm on a shaker for 6 h at 4 °C. After centrifugation at 17,000 g for 15 min at 4°C, 850 µl of the supernatant was transferred to a new tube. Then all samples were evaporated to dryness using a SpeedVac concentrator (Thermo Savant). The samples were then stored in a −80 °C freezer before performing metabolomic profiling analysis. Before injected into LC-MS machine, metabolites were reconstituted in 50 µl of 0.03% formic acid in analytical-grade water, vortex-mixed, and centrifuged to remove debris.
- Downstream: Targeted metabolomics
Targeted metabolomics use tailored mass spectrometry approaches to assess the levels of specific metabolites pre-chosen by the user or the facility. These may include single metabolites for absolute quantitation (metabolite quant), several metabolites chosen to assess a single pathway (pathway analysis), or screening analysis using assays developed by the facility to detect hundreds of metabolites simultaneously.
- ref. parameters on LC-MS:
-
Nexera Ultra High Performance Liquid Chromatograph (UHPLC) system (Shimadzu Corporation):
- Separation column: Phenomenex Synergi Polar-RP HPLC column (150 × 2 mm, 4 µm, 80 Å)
- The mobile phases: 0.03% formic acid in water (A) and 0.03% formic acid in acetonitrile (B).
- The gradient program: 0-3 min, 0% B; 3-15 min, 0% - 100% B; 15-17 min, 100% B; 17-17.1 min, 100% - 0% B; 17.1-20 min, 0% B.
- injection volume: 20 µL
-
SCIEX QTRAP 5500 (triple quadrupole (QqQ) mass spectrometer):
- Multiple reaction monitoring (MRM)
- MS/MS detector conditions: [curtain gas 30 psi | ion spray voltages 1200 V (positive) and -1500 V (negative) | temperature 650°C | ion source gas 150 psi | ion source gas 2 50 psi | interface heater on | entrance potential 10 V]
- Dwell time for each transition was set at 3 ms.
- Sample analysis was performed in positive/negative switching mode.
- Declustering potential (DP), collision energy (CE) and Collision Cell Exit Potential (CXP) were optimized for each metabolite by direct infusion of reference standards using a syringe pump prior to sample analysis.
-
Selected reaction monitoring (SRM)
-
- Downstream: Untargeted metabolomics
Untargeted metabolomics is a shotgun-like approach that acquires all possible metabolite data from experimental samples with no prioritization of which pathways might be informative. The method reports the maximum number of metabolic features (i.e., “peaks”) and identifies as many of these as possible by comparing the precise molecular mass and MS2 spectra to commercial databases.
1. ref. parameters on LC-MS:
2. ref. parameters on LC-IM-MS (ion mobility-resolved): [ref. DOI Link]
-
UHPLC system (1290 series, Agilent Technologies, USA)
- For HILIC separation:
- Separation columns: Waters ACQUITY UPLC BEH Amide column (particle size, 1.7 μm; 100 mm (length) × 2.1 mm (i.d.)); column temperature: 25 °C.
- mobile phase A:
- The gradient program: 0–0.5 min: 95% B, 0.5–7 min: 95% B to 65% B, 7–8 min: 65% B to 40% B, 8–9 min: 40% B, 9–9.1 min: 40% B to 95% B, and 9.1–12 min: 95% B. The flow rate was 0.5 mL/min.
- injection volume: 3 µL
- For reverse phase (RP) separation:
- Separation columns: Phenomenex Kinetex C18 column (particle size, 2.6 μm; 100 mm (length) × 2.1 mm (i.d.)); column temperature: 25 °C.
- The gradient program: 0–1 min: 1% B, 1–8 min: 1% B to 99% B, 8–9 min: 99% B, 9–9.1 min: 99% B to 1% B, 9.1–12 min: 1% B. The flow rate was 0.3 mL/min.
- injection volume: 3 µL
- For HILIC separation:
-
timsTOF Pro
- electrospray ionization (ESI) source: Bruker Daltonics, Bremen, Germany
- DTIM-MS 6560 (Agilent Technologies, USA)
- PASEF-DDA scan mode:
- mass range from 20 to 1300 Da and mobility range from 0.45 to 1.45 V·s/cm2
- capillary voltages: +4500 V for positive ionization mode; −3600 V for negative ionization mode;
- nebulizer pressure, 2.2 bar; dry gas, 10.0 L/min; dry temperature, 220 °C;
- number of PASEF MS/MS scans, 2; ramping time, 100 ms; TIMS stepping enabled; total cycle time, 0.53 s; charge range, 0–1; absolute threshold, 100 cts;
- active exclusion, checked; former target ions released after 0.1 min; isolation window, 1.2 Da; collision energy, 30 eV.
- PASEF-DIA scan mode:
- 7 mass steps with mass width of 144.3 Da and mass overlap of 5 Da were set in each cycle, covering the mass ranges of 20–1000 Da and mobility range of 0.45–1.45 V·s/cm2.
- The cycle time is 0.64 s.
- For IM-AIF data acquisition:
- sheath gas temperature, 325 °C; dry gas temperature, 300 °C; sheath gas flow, 11 L/min;
- dry gas flow, 8 L/min; capillary voltage, 4000 V; and nebulizer pressure, 20 psi. The TOF mass range was set as m/z 50–1700 Da.
- For ion mobility parameters, nitrogen (N2) was used for the drift gas.
-
Isotope Enrichment Analysis
Metabolomics analysis softwares
- MetaboAnalyst: v5.0
- MZmine3
- MS-DIAL
- MaxQuant
- SpatialMeta
- MultiQuant software, SCIEX
- LipidBlast
- Progenesis QI: Progenesis QI is small molecule discovery analysis software for your LC-MS data.
- msConvert (Proteowizzard): A tool required to convert vendor specific files (e.g. Thermo .RAW) to open source formats mzML or mzXML.
Metabolomics resources
- Human Metabolome Database (HMDB): Includes experimental and/or predicted MS/MS spectra for 114,224 metabolites.
- Metlin: A vast database containing experimental MS/MS spectra where available.
- mzCloud: Thermo’s fully curated spectral library with data collected solely on orbitraps.
- Compound Discoverer Help: Help with Thermo’s untargeted analysis software.
Ref. Labs
-
Metabolomics Facility, Children’s research institute at UTSW
- HILIC Plasma Serum Extraction Protocol [PDF | PMID: 27545456]
- HILIC Adherent Cell Lines Extraction Protocol [PDF | PMID: 28538732]
- HILIC Tissue Extraction Protocol [PDF | PMID: 28825709]
-
West Coast Metabolomics Center, UC Davis
-
Fiehn Laboratory for Untargeted Metabolomics (Oliver Fiehn lab)
- ThermoFisher Vanquish UHPLC + Sciex QTRAP 6500+ mass spectrometer
- ThermoFisher Vanquish UHPLC + Sciex Triple TOF mass spectrometer
- ThermoFisher Vanquish UHPLC + ThermoFisher Altis triple quadrupole mass spectrometers
- Vanquish UHPLC + ThermoFisher Orbitrap mass spectrometers (Q-Exactive, IQX, Exploris models)
- Vanquish UHPLC + Bruker timsTOF mass spectrometer flex
- Chemical and Informatics Resources: The Fiehn laboratory has purchased over 6,500 chemical reference standards for identification and quantifications and hosts several metabolomics databases.
-
Newman Laboratory for Lipid Mediators
-
Hammock Laboratory for Inflammatory Metabolism
-
-
Zhengjiang Zhu lab, Interdisciplinary Research Center on Biology and Chemistry (IRCBC), Chinese Academy of Sciences (CAS)
Online courses
-
2018 North American Mass Spectrometry Summer School (1st Annual)
- MS-based compound identification in untargeted metabolomics, Oliver Fiehn, University of California-Davis
- Protein Quantification by Mass Spectrometry Part II/Development and Application of Chemical Tags, Lingjun Li, University of Wisconsin-Madison
-
2019 North American Mass Spectrometry Summer School (2nd Annual)
- Ionization, Evan R. Williams
- Quantitative Proteomics, Lingjun Li
- Exploring Proteomes Using Discovery and Targeted Mass Spectrometry Approaches, Ulrike Kusebauch
- Acquisition Methods-DDA, DIA and PRM, Jesse G. Meyer
- Spectral Interpretation, Beatrix Ueberheide
- Science Writing, Alicia Williams
- Post-translational Modifications, Judit Villen
- Mass Analyzers, Michael Westphall
-
2021 North American Mass Spectrometry Summer School (3nd Annual)
- Deconstructing a Mass Spectrometer, Mike Westphall/Kenny Lee
- Separation Science of Complex Biological Mixtures, Susan Olesik
- Tandem MS, Joshua Coon
- Data Analysis and interpretation with MaxQuant and Perseus, Jürgen Cox
- Publishing your Science, Shawnna Buttery
- How to Set-up an LC Run, Laura Muehlbauer/Justin McKetney
- How to Calibrate a Mass Spectrometer, Austin Salome/Trent Peters-Clarke
- Post-translational Modifications, Evgenia Shishkova
- Experimental Design for Quantitative Proteomics, Edward Huttlin
- Metabolomics, Jessica Prenni
- Lipidomics, John A. Bowden
- Top-down and Native MS, Vicki Wysocki; nMS-to-SB
- Data Acquisition Methods, Jesper Velgaard Olsen
-
2022 North American Mass Spectrometry Summer School (4th Annual): Tutorial lecture topics include: Mass Analyzers, Ionization, Tandem MS, Chromatography, Shotgun Proteomics, Instrument Acquisition and Setup, Data analysis, and PTMs. Also planned are lectures workshops for scientific and professional development.
- Exploring the “Social Network” within a Human Cell, Edward Huttlin
- Future Technology Needs, Panel Discussion
Panelists: John A. Bowden, Ben Garcia, Jessica Prenni, Edward Huttlin, Lingjun Li, Rachel Loo, David Geffen, Vicki Wysocki
-
2023 North American Mass Spectrometry Summer School (5th Annual)
-
2025 North American Mass Spectrometry Summer School (6th Annual)
Textbooks
- <Mass Spectrometry – Principle and Applications>, By: Edmond de Hoffman and Vincent Stroobant [Download PDF]
Nobel laureates
-
Koichi Tanaka, Shimadzu Corp., Kyoto, Japan
The Nobel Prize in Chemistry 2002
The Origin of Macromolecule Ionization by Laser Irradiation [Nobel Lecture video | Read the Lecture] -
John B. Fenn, Virginia Commonwealth University, Richmond, VA, USA
The Nobel Prize in Chemistry 2002
Electrospray Wings for Molecular Elephants [Nobel Lecture video |Read the Lecture] -
Francis W. Aston, University of Cambridge, Cambridge, United Kingdom
The Nobel Prize in Chemistry 1922
Mass Spectra and Isotopes [Read the Lecture] -
Joseph John Thomson (J.J. Thomson), University of Cambridge, Cambridge, United Kingdom
The Nobel Prize in Chemistry 1906
Carriers of Negative Electricity [Documentary video | Read the Lecture]