
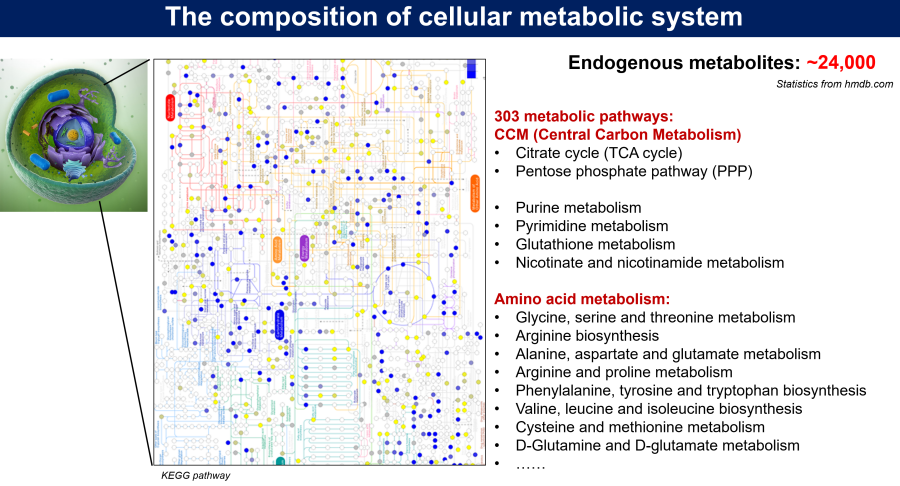
Brain metabolic system
Metabolism is physiologically fundamental to a biological system. Understanding brain metabolism is critical for our comprehensive knowledge of brain function in health and disease. In addition, brain is the most heterogeneous organ across whole body, in order to understand the metabolic basis, a detailed spatial metabolome atlas is needed.
Our research employs quantitative metabolomics to construct a comprehensive map of the metabolic landscape within the mammalian brain. Understanding this intricate environment is essential, as the availability and concentration of metabolites fundamentally dictate neuronal function, signaling, and pathology.
1. Spatial profiling of endogenous metabolites in mouse brain
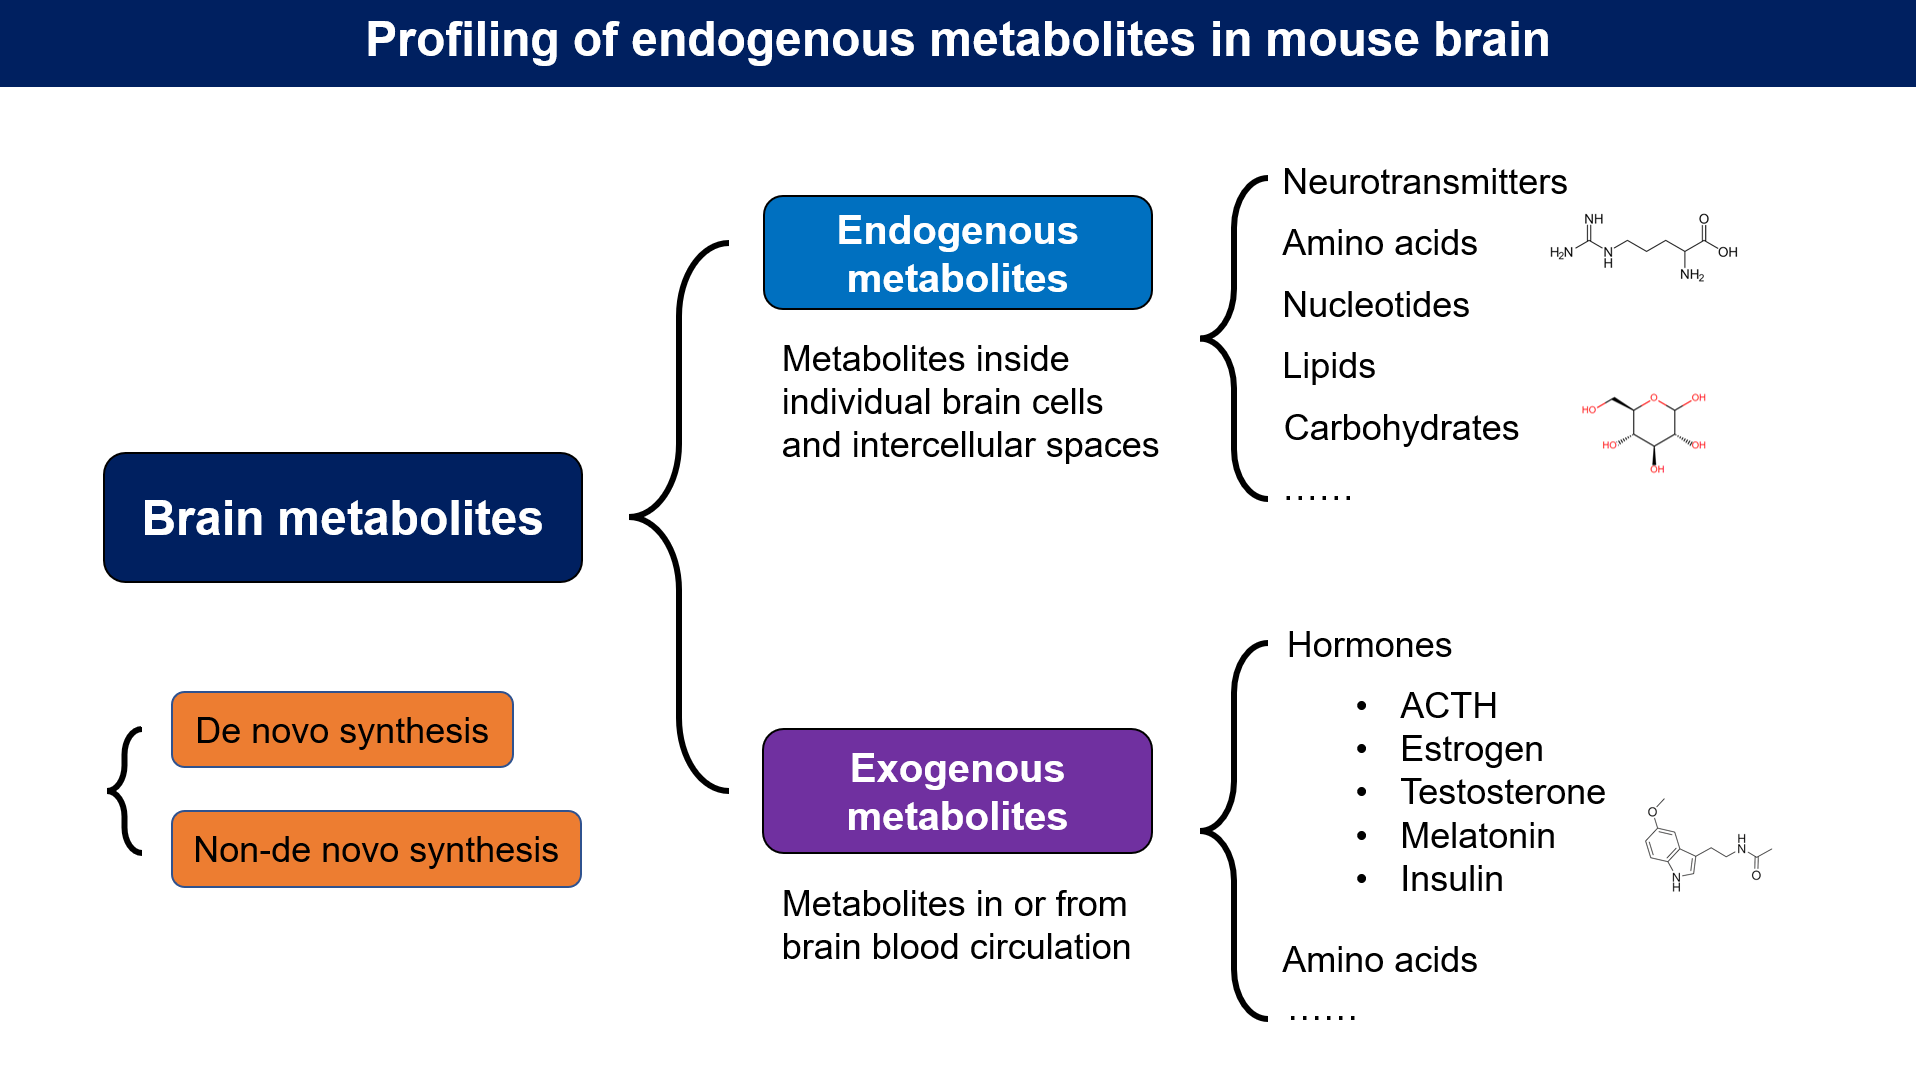
We focus on differentiating and quantifying two primary classes of metabolites in mouse brain tissue, one is Endogenous Metabolites, These are molecules produced by individual brain cells and present in the intarcellular spaces. This category includes critical cellular components such as: Neurotransmitters, Amino Acids & Nucleotides, Lipids and Carbohydrates.
Second is Exogenous Metabolites, These are molecules that enter the brain via the blood-brain barrier (BBB) from the systemic circulation. This category includes systemic signals crucial for brain function: Hormones and Systemic Amino Acids.
In our study, we designed a micro-tube collection array (MCA) system and integrated it with targeted/untargeted metabolomics analysis and performed precision mapping of the metabolome in the mouse brain, and created maps for 79 metabolites with a resolution of 0.125mm^3 per pixel (i.e., brain sub-region).

Figure 1 | Significant metabolomic heterogeneity across different brain regions. (a) UMAP dimensionality reduction and Louvain clustering analysis of 157 micro-regions. Five distinct clusters (numbered 0-4) were identified. Each point represents a micro-region, and those belonging to the same cluster are color-coded accordingly. (b) Spatial mapping of the five brain micro-region clusters from the microarray plate. The color of each well corresponds to the cluster identity in (a). (c) Spatial abundance heatmaps of six representative metabolites enriched in different brain regions. The top row shows Choline and Gamma-Aminobutyric acid (GABA), enriched in the thalamus and hypothalamus. The middle row shows Pipecolic acid and cyclic ADP-ribose, enriched in the cortex. The bottom row shows Creatinine and Cytidine monophosphate (CMP), enriched in the hippocampus. In the color bar, deep red and dark blue indicate higher and lower metabolite concentrations, respectively. Values for each metabolite were normalized to the total ion chromatogram (TIC).
Browse our project: shiny app
One the road of discovering new brain-active metabolites……
2. Brain metabolome with high spatial resolution
3. Brain specific solute carrier (SLC) transporters
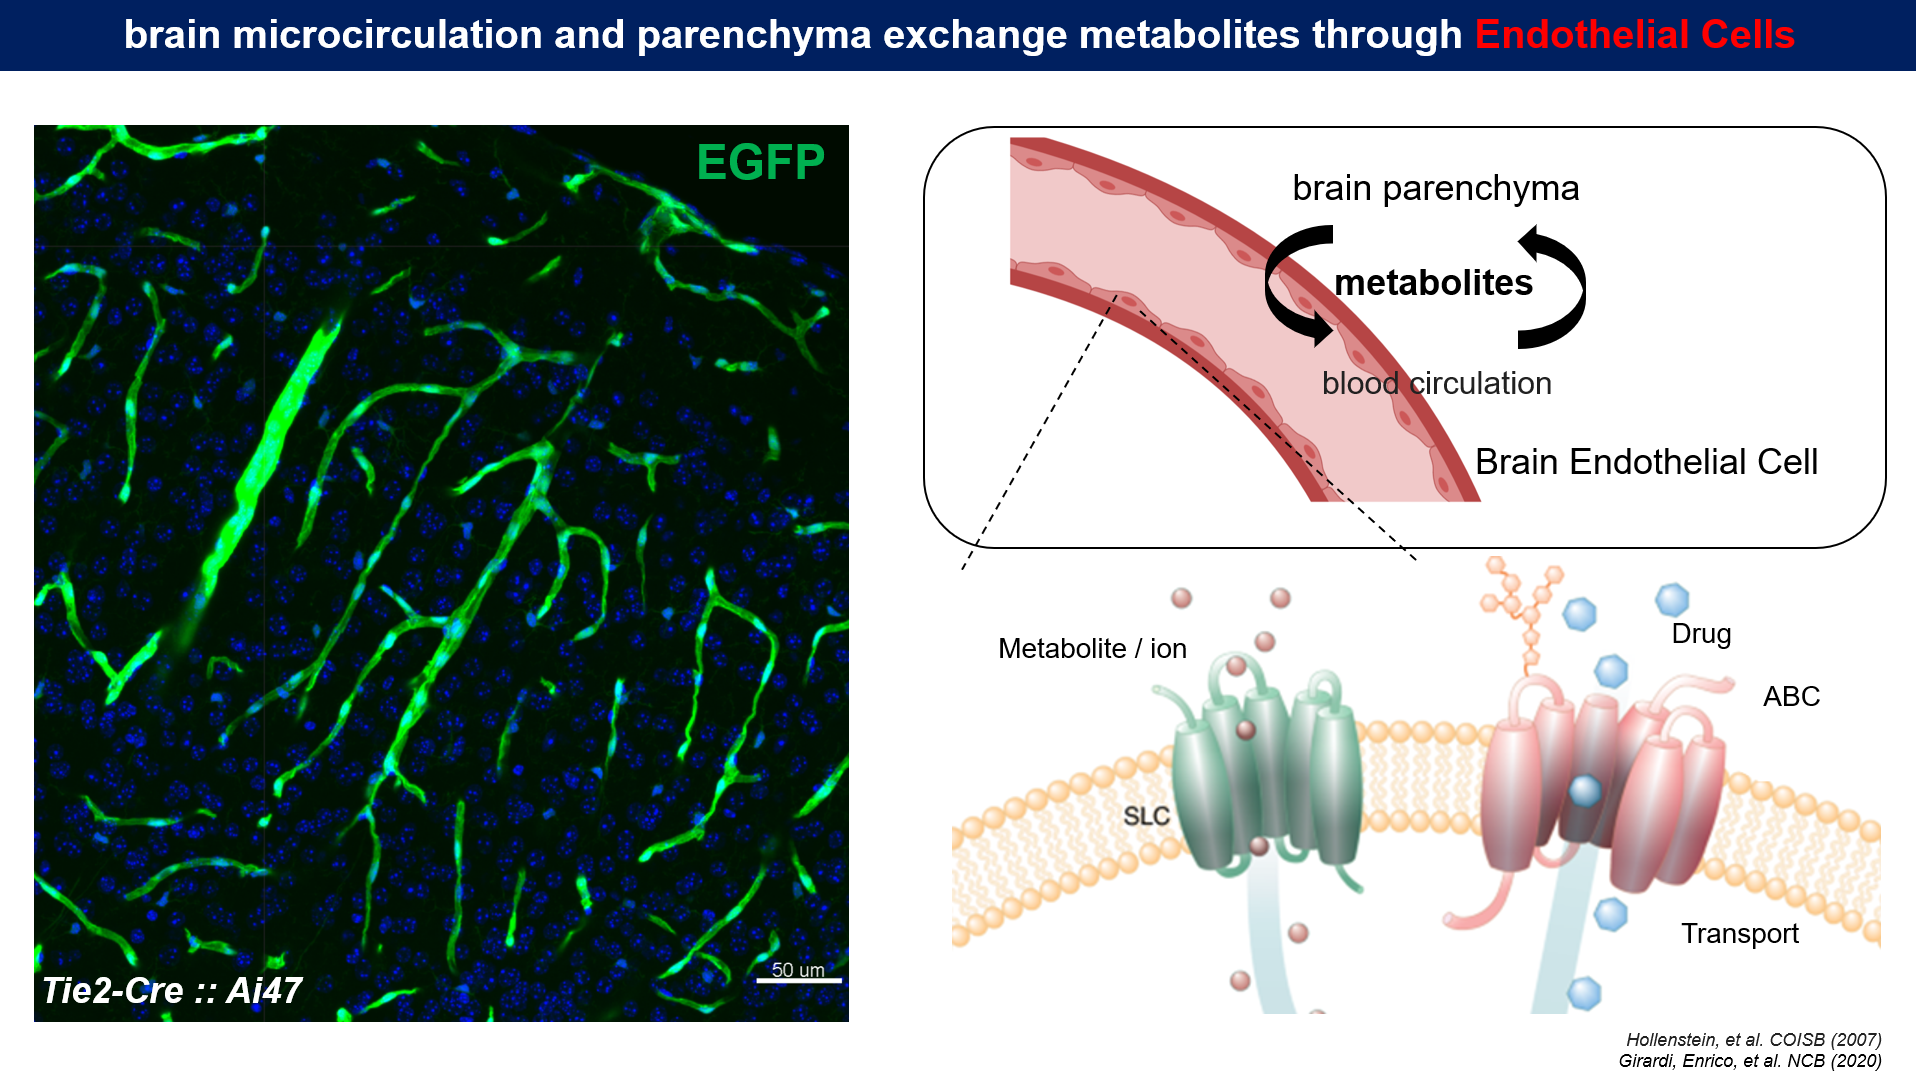 Endogenous metabolites play important roles in the regulation of cellular activity. Our brain is in a dynamic state, communication between different cell types (Excitatory neuron, Inhibitory neuron, Microglia, Oligodendrocyte, Astrocyte, ect) depends on small metabolites. Cerebrovascular spread to whole brain and import some metabolites from peripheral system or export some metabolites outside CNS. It is important to have a comprehensive profile for gene expression of transporters across brain vasculature segmentations.
One the road of discovering new metabolic machinery……