Draw connecting routes on map with R
Draw an empty map
Note: If you want to learn more about building maps in R, go to the background map section.
# World map is available in the maps package
library(maps)

# No margin
par(mar=c(0,0,0,0))

# World map
map('world',
    col="#f2f2f2", fill=TRUE, bg="white", lwd=0.05,
    mar=rep(0,4),border=0, ylim=c(-80,80)
)
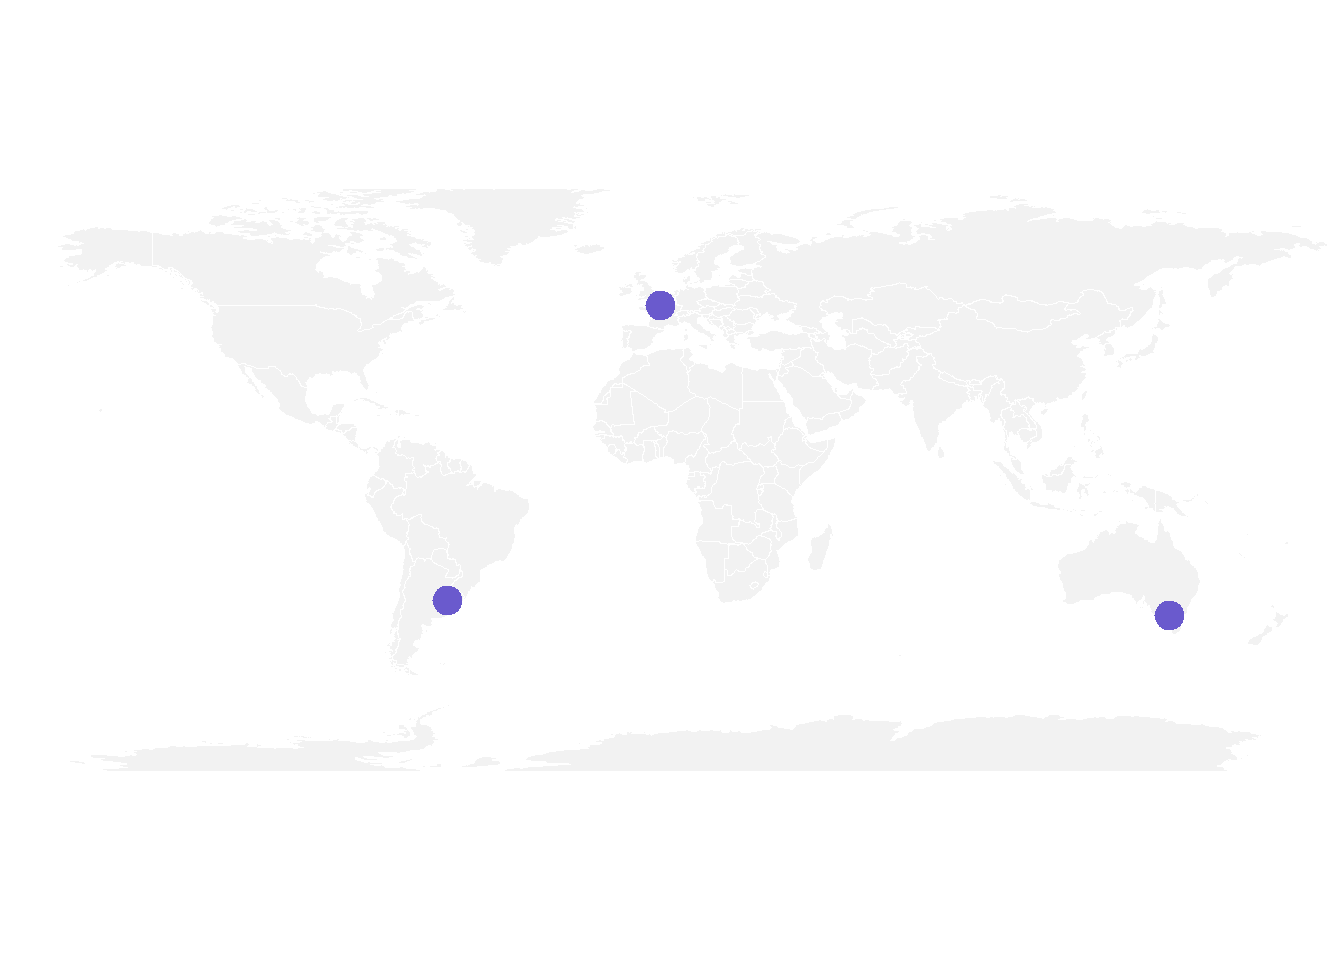
Add three cities
Using the points() function, you can easily add circles at specific locations. The most difficult part will most likely be determining the longitude and latitude of the cities of interest.
# Dplyr for data wrangling and pipe function
library(dplyr)
##
## 载入程辑包:'dplyr'
## The following objects are masked from 'package:stats':
##
##     filter, lag
## The following objects are masked from 'package:base':
##
##     intersect, setdiff, setequal, union

# Cities
Buenos_aires <- c(-58,-34)
Paris <- c(2,49)
Melbourne <- c(145,-38)

# Data frame
data <- rbind(Buenos_aires, Paris, Melbourne) %>%
  as.data.frame()
colnames(data) <- c("long","lat")

# Show the cities on the map
map('world',
    col="#f2f2f2", fill=TRUE, bg="white", lwd=0.05,
    mar=rep(0,4),border=0, ylim=c(-80,80)
)
points(x=data$long, y=data$lat, col="slateblue", cex=3, pch=20)
Show connection between cities
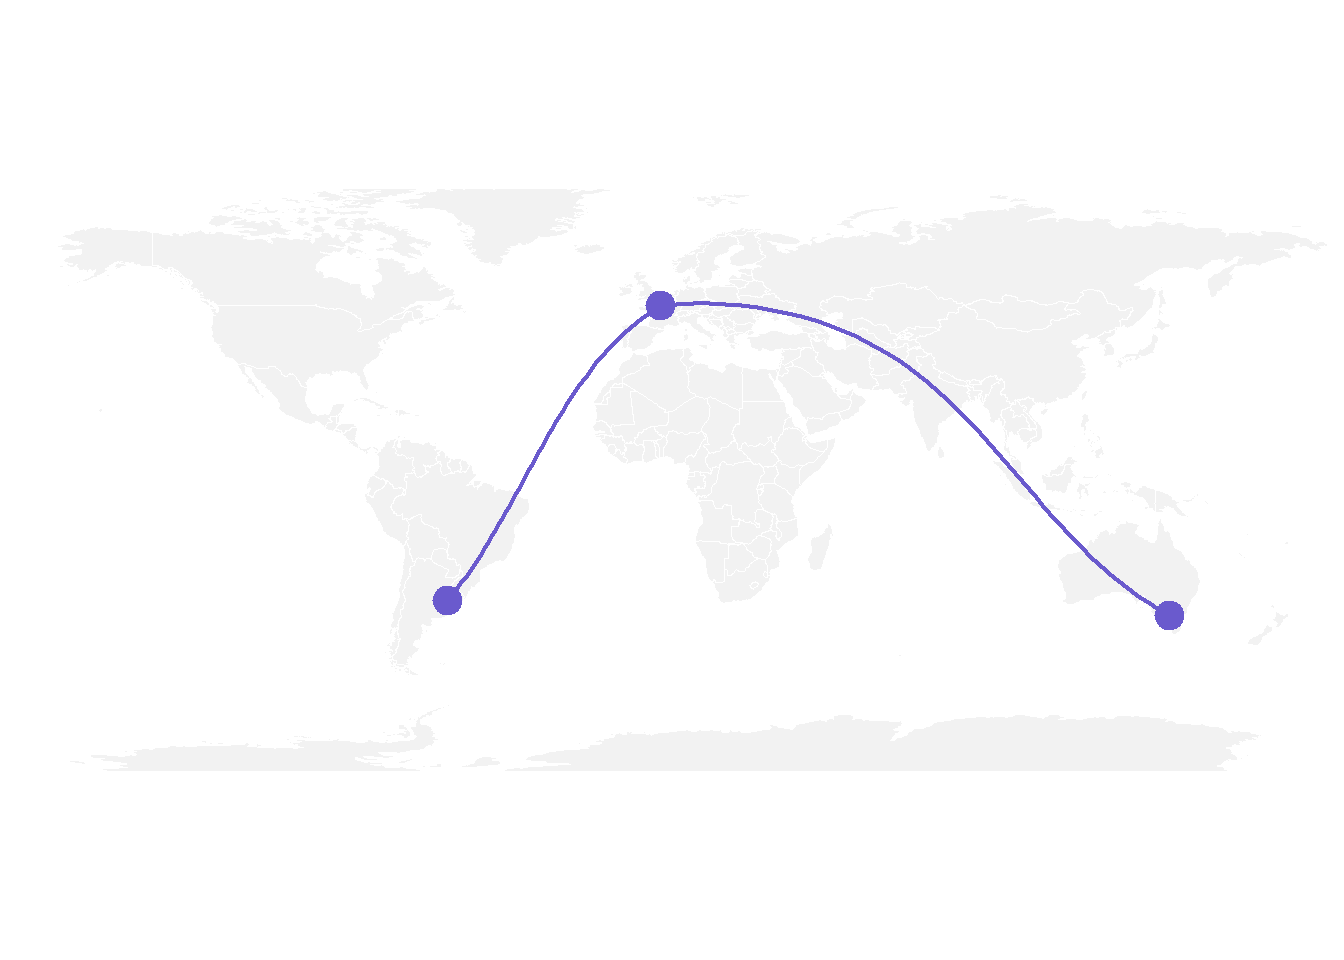
Now we can connect cities drawing the shortest route between them. This is done using great circles, what gives a better visualization than using straight lines.
The gcIntermediate() function, which calculates the path, is available in the geosphere package. The lines() method can then be used to plot this path.
# Load geosphere
library(geosphere)

# Background map
map('world',
    col="#f2f2f2", fill=TRUE, bg="white", lwd=0.05,
    mar=rep(0,4),border=0, ylim=c(-80,80)
)

# Dot for cities
points(x=data$long, y=data$lat, col="slateblue", cex=3, pch=20)

# Compute the connection between Buenos Aires and Paris
inter <- gcIntermediate(Paris,  Buenos_aires, n=50, addStartEnd=TRUE, breakAtDateLine=F)

# Show this connection
lines(inter, col="slateblue", lwd=2)

# Between Paris and Melbourne
inter <- gcIntermediate(Melbourne,  Paris, n=50, addStartEnd=TRUE, breakAtDateLine=F)
lines(inter, col="slateblue", lwd=2)
Apply it to several pairs of cities
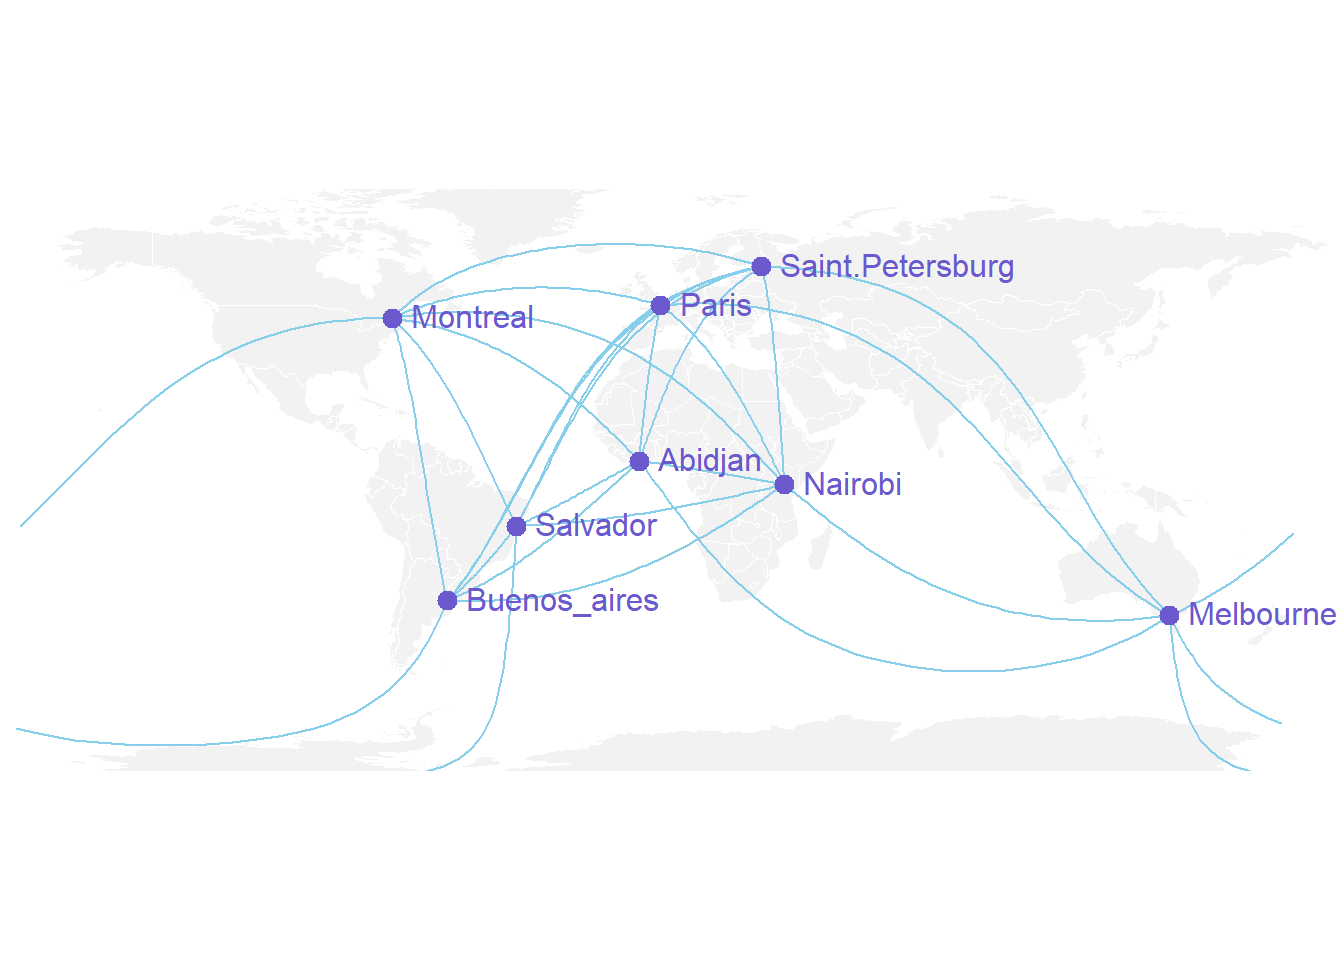
Building a for loop that draws connections one at a time is quite feasible if we want to plot a large number of connections.
Additionally, take notice of how city names were added using the text function.
# A function to plot connections
plot_my_connection=function( dep_lon, dep_lat, arr_lon, arr_lat, ...){
    inter <- gcIntermediate(c(dep_lon, dep_lat), c(arr_lon, arr_lat), n=50, addStartEnd=TRUE, breakAtDateLine=F)
    inter=data.frame(inter)
    diff_of_lon=abs(dep_lon) + abs(arr_lon)
    if(diff_of_lon > 180){
        lines(subset(inter, lon>=0), ...)
        lines(subset(inter, lon<0), ...)
    }else{
        lines(inter, ...)
        }
    }

# Create dataset
data <- rbind(
    Buenos_aires=c(-58,-34),
    Paris=c(2,49),
    Melbourne=c(145,-38),
    Saint.Petersburg=c(30.32, 59.93),
    Abidjan=c(-4.03, 5.33),
    Montreal=c(-73.57, 45.52),
    Nairobi=c(36.82, -1.29),
    Salvador=c(-38.5, -12.97)
    )  %>% as.data.frame()
colnames(data)=c("long","lat")

# Generate all pairs of coordinates
all_pairs <- cbind(t(combn(data$long, 2)), t(combn(data$lat, 2))) %>% as.data.frame()
colnames(all_pairs) <- c("long1","long2","lat1","lat2")

# background map
par(mar=c(0,0,0,0))
map('world',col="#f2f2f2", fill=TRUE, bg="white", lwd=0.05,mar=rep(0,4),border=0, ylim=c(-80,80) )

# add every connections:
for(i in 1:nrow(all_pairs)){
    plot_my_connection(all_pairs$long1[i], all_pairs$lat1[i], all_pairs$long2[i], all_pairs$lat2[i], col="skyblue", lwd=1)
    }

# add points and names of cities
points(x=data$long, y=data$lat, col="slateblue", cex=2, pch=20)
text(rownames(data), x=data$long, y=data$lat,  col="slateblue", cex=1, pos=4)
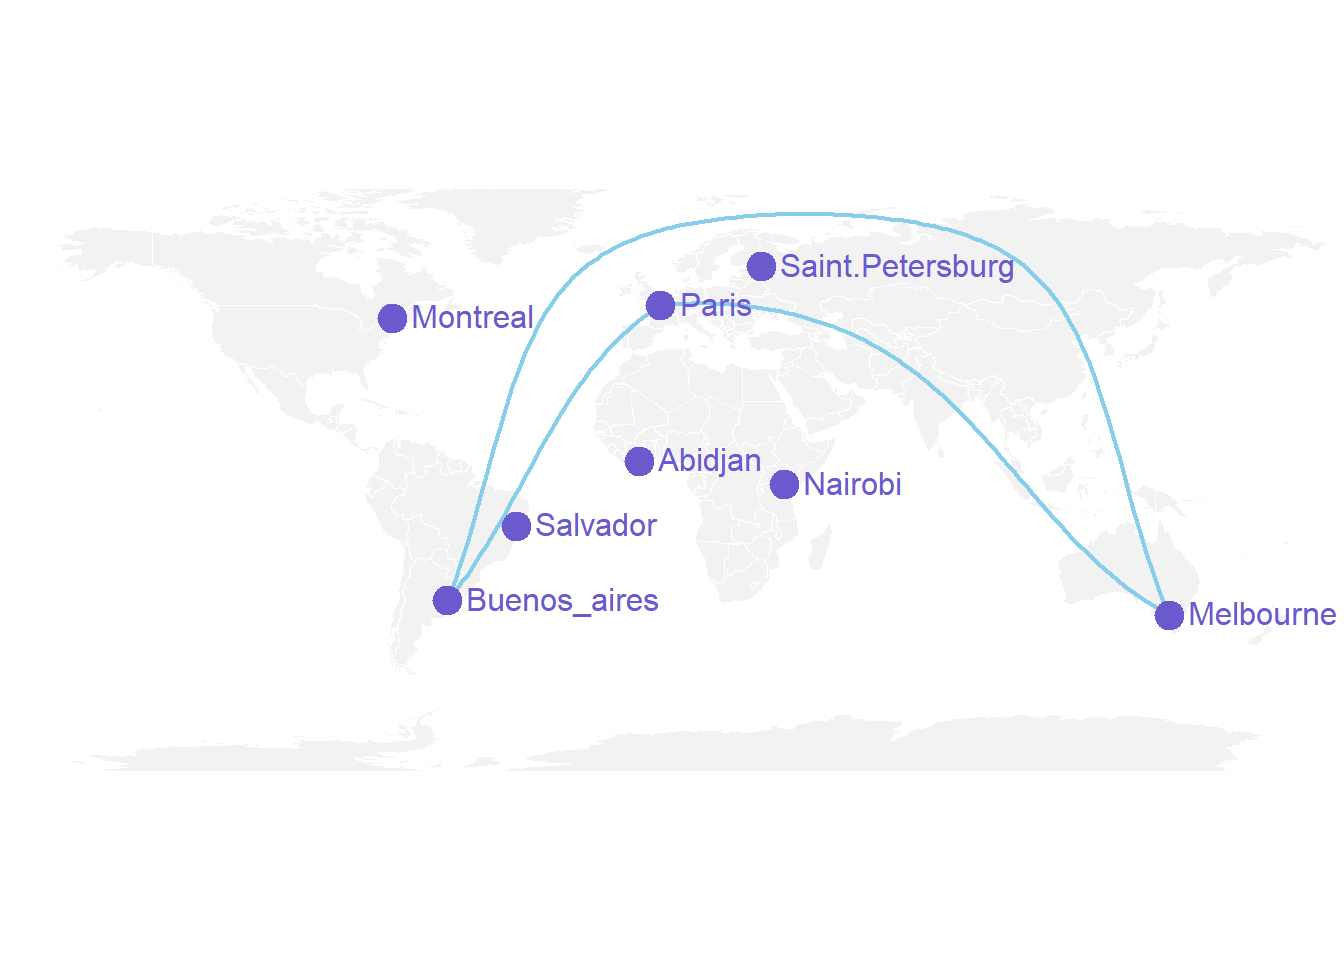
An alternative using the greatCircle function
This approach is recommended by the Simply Statistics Blog for creating a twitter relationship map.
Calculating the entire great circle is intended, and only that portion should be kept because it never crosses over onto the back of the map.
# A function that keeps the good part of the great circle, by Jeff Leek:
getGreatCircle <- function(userLL,relationLL){
  tmpCircle = greatCircle(userLL,relationLL, n=200)
  start = which.min(abs(tmpCircle[,1] - data.frame(userLL)[1,1]))
  end = which.min(abs(tmpCircle[,1] - relationLL[1]))
  greatC = tmpCircle[start:end,]
  return(greatC)
}

# background map
map('world',col="#f2f2f2", fill=TRUE, bg="white", lwd=0.05,mar=rep(0,4),border=0, ylim=c(-80,80) )

# map 3 connections:
great <- getGreatCircle(Paris, Melbourne)
lines(great, col="skyblue", lwd=2)
great <- getGreatCircle(Buenos_aires, Melbourne)
lines(great, col="skyblue", lwd=2)
great <- getGreatCircle(Paris, Buenos_aires)
lines(great, col="skyblue", lwd=2)

# City names and dots
points(x=data$long, y=data$lat, col="slateblue", cex=3, pch=20)
text(rownames(data), x=data$long, y=data$lat,  col="slateblue", cex=1, pos=4)
