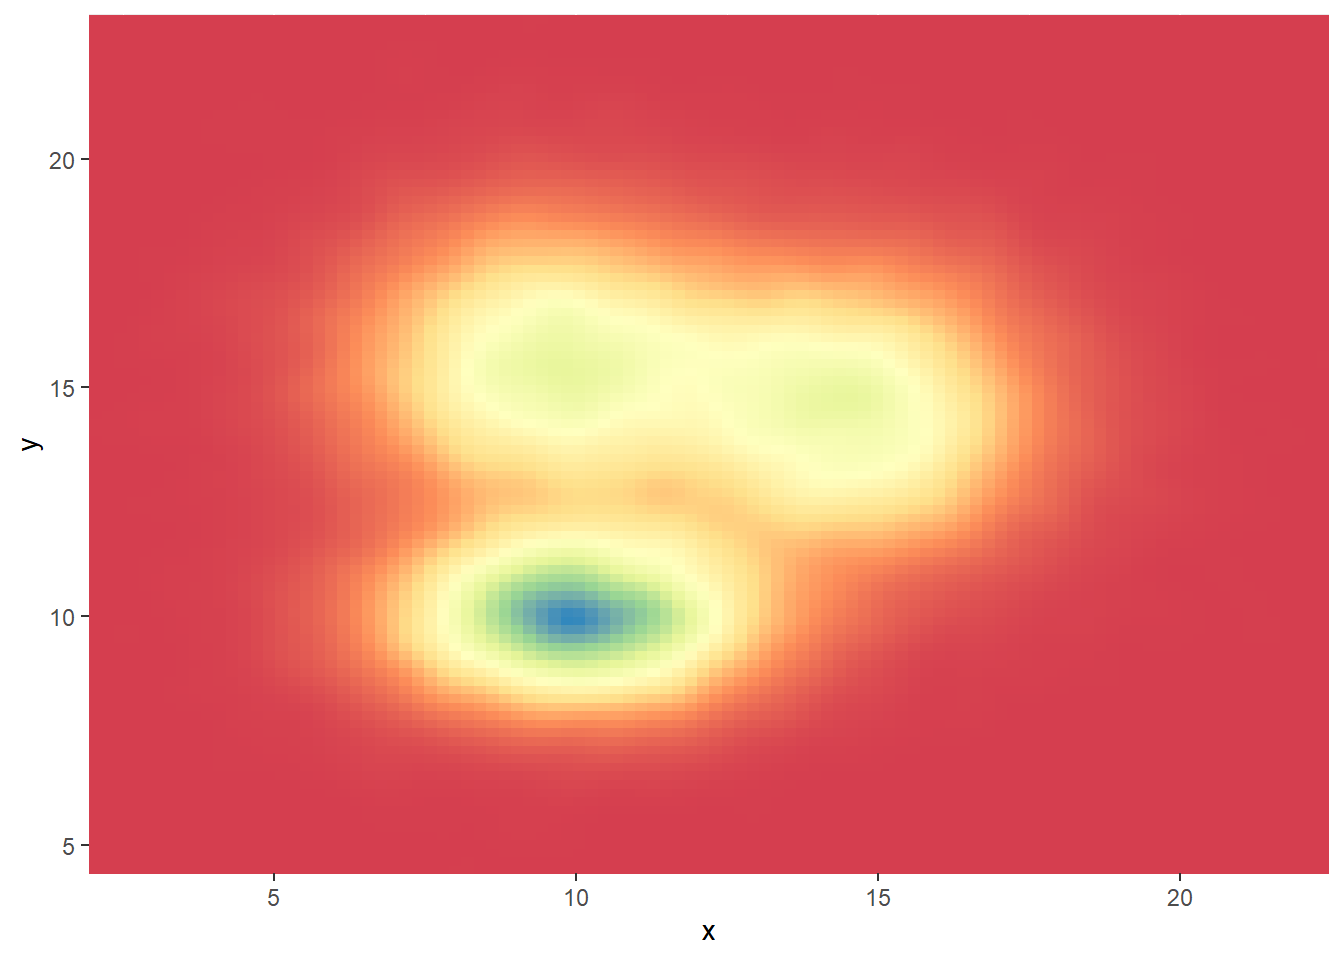
R plot 2d density
a 2d density plot using ggplot2
If you have a large number of points, a 2d density plot is helpful for examining the connection between 2 numerical variables.
It divides the plot area into several little fragments to prevent overlapping (as in the scatterplot next to it) and shows the number of points in each fragment.
Different kinds of 2D density graphs exist. Everyone has the appropriate ggplot2 function. All of them are discussed in this post.
This is how you can insert a R code chunk:
# Library
library(tidyverse)
## -- Attaching packages --------------------------------------- tidyverse 1.3.1 --
## v ggplot2 3.3.5     v purrr   0.3.4
## v tibble  3.1.6     v dplyr   1.0.7
## v tidyr   1.1.4     v stringr 1.4.0
## v readr   2.1.1     v forcats 0.5.1
## -- Conflicts ------------------------------------------ tidyverse_conflicts() --
## x dplyr::filter() masks stats::filter()
## x dplyr::lag()    masks stats::lag()

# Data
a <- data.frame( x=rnorm(20000, 10, 1.9), y=rnorm(20000, 10, 1.2) )
b <- data.frame( x=rnorm(20000, 14.5, 1.9), y=rnorm(20000, 14.5, 1.9) )
c <- data.frame( x=rnorm(20000, 9.5, 1.9), y=rnorm(20000, 15.5, 1.9) )
data <- rbind(a,b,c)


# Basic scatterplot
ggplot(data, aes(x=x, y=y) ) +
  geom_point()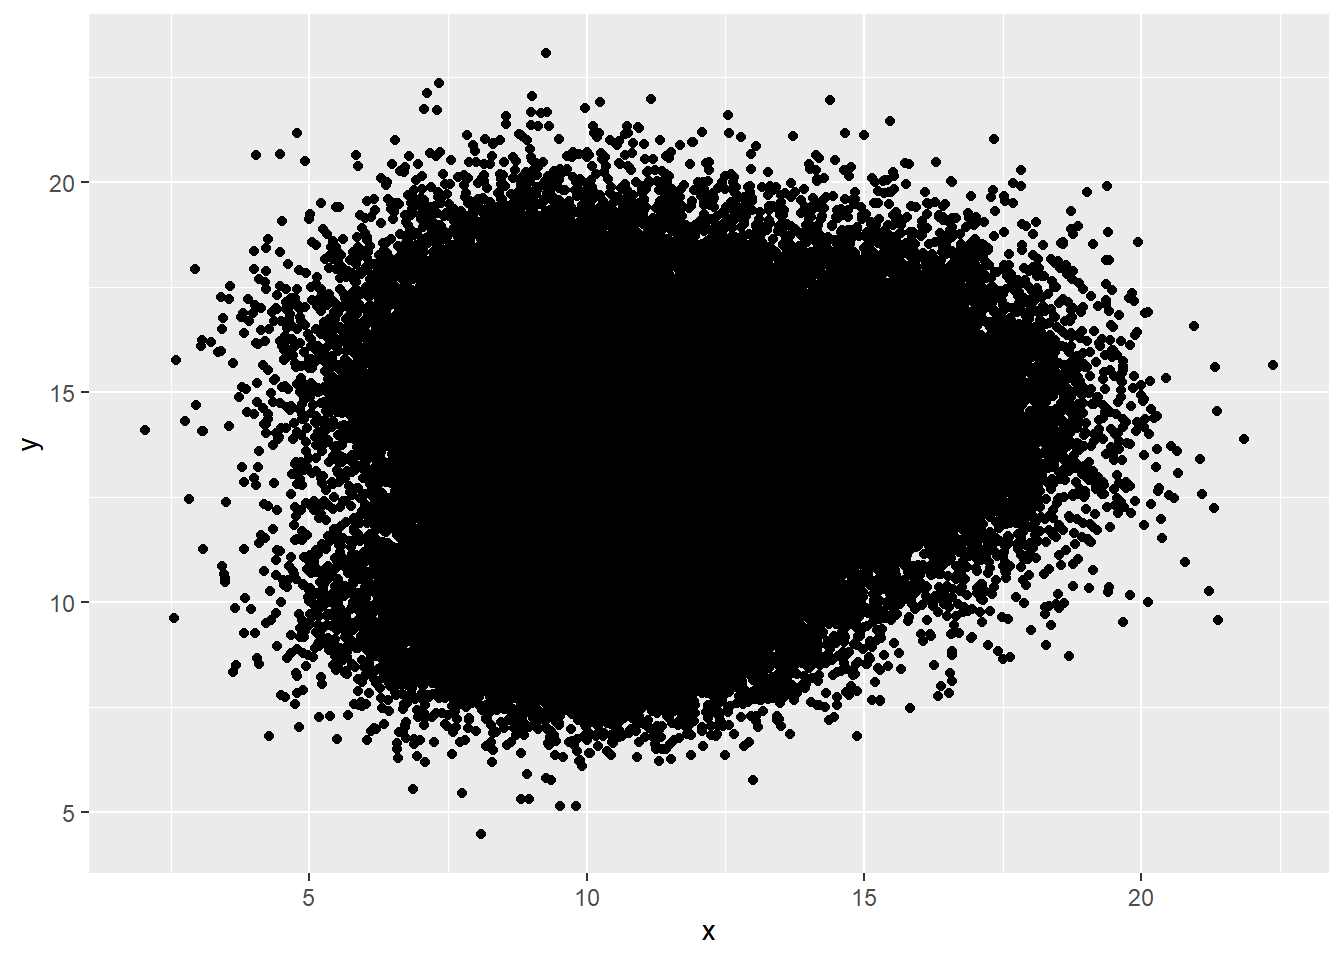
library(ggplot2)
# Show the contour only
ggplot(data, aes(x=x, y=y) ) +
  geom_density_2d()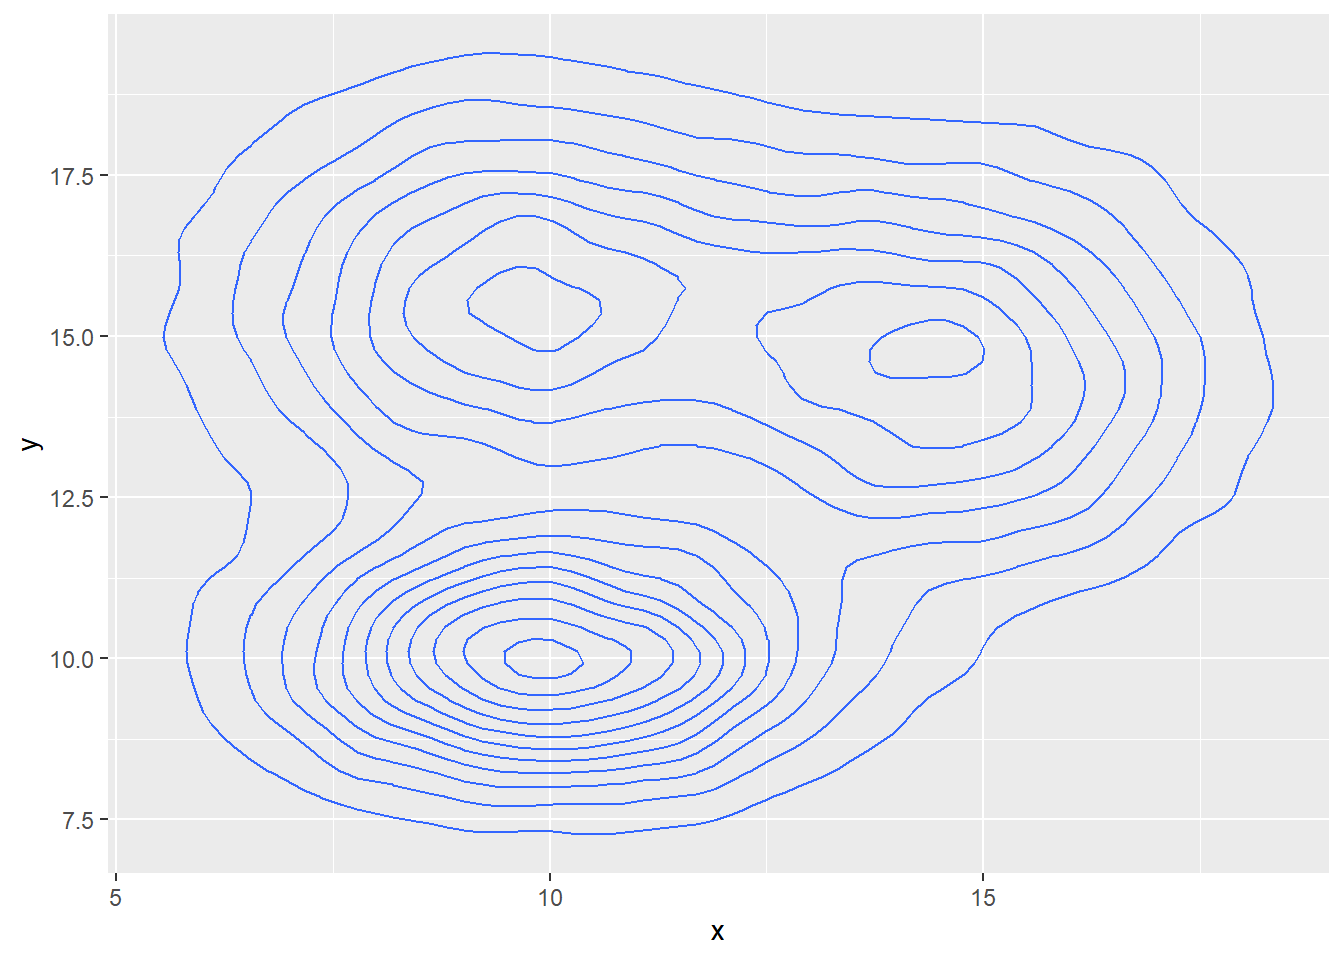
# Show the area only
ggplot(data, aes(x=x, y=y) ) +
  stat_density_2d(aes(fill = ..level..), geom = "polygon")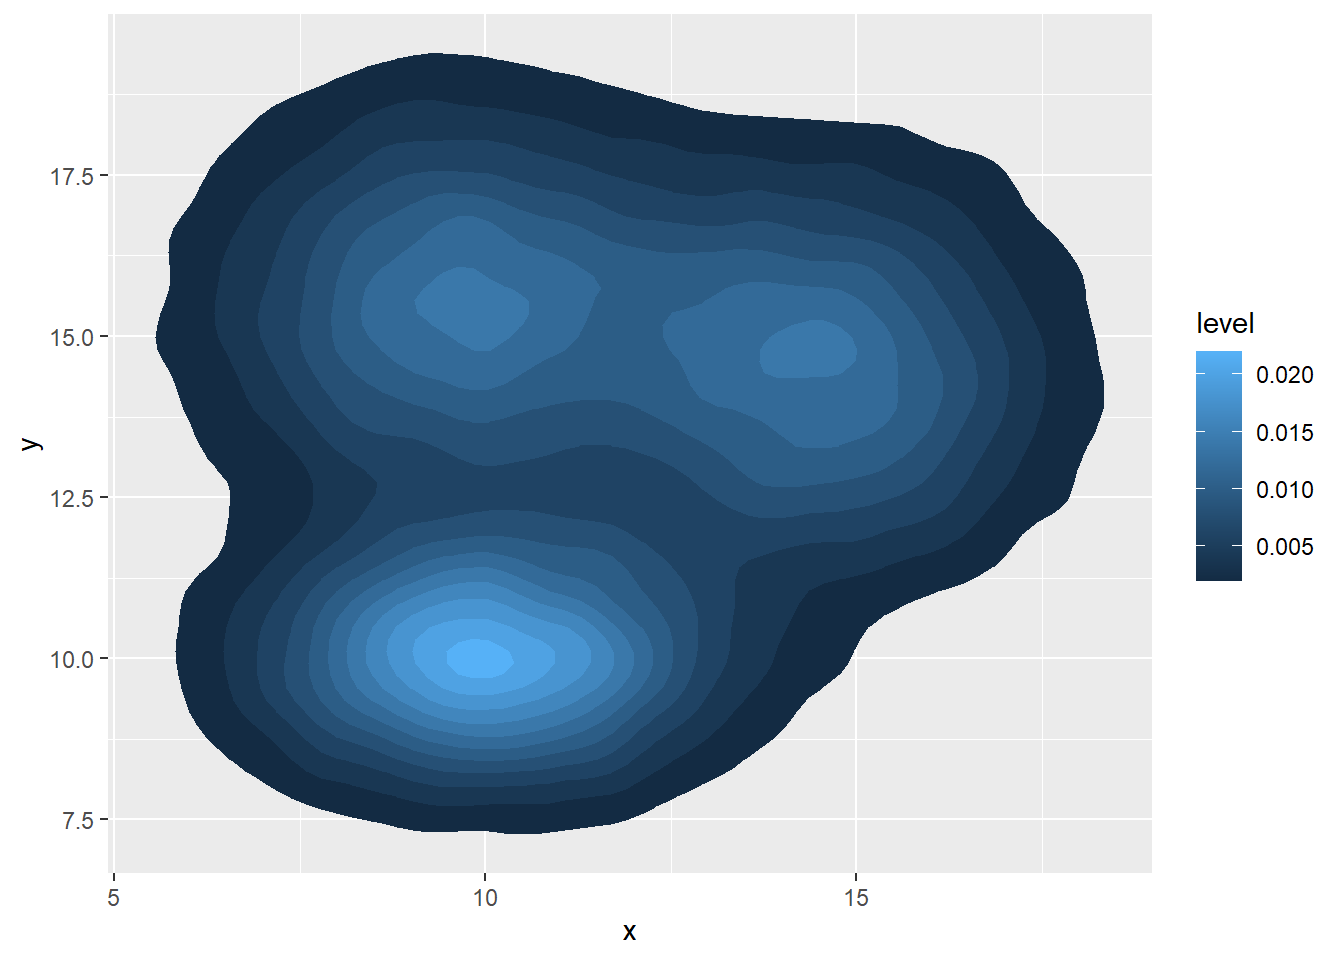
# Area + contour
ggplot(data, aes(x=x, y=y) ) +
  stat_density_2d(aes(fill = ..level..), geom = "polygon", colour="white")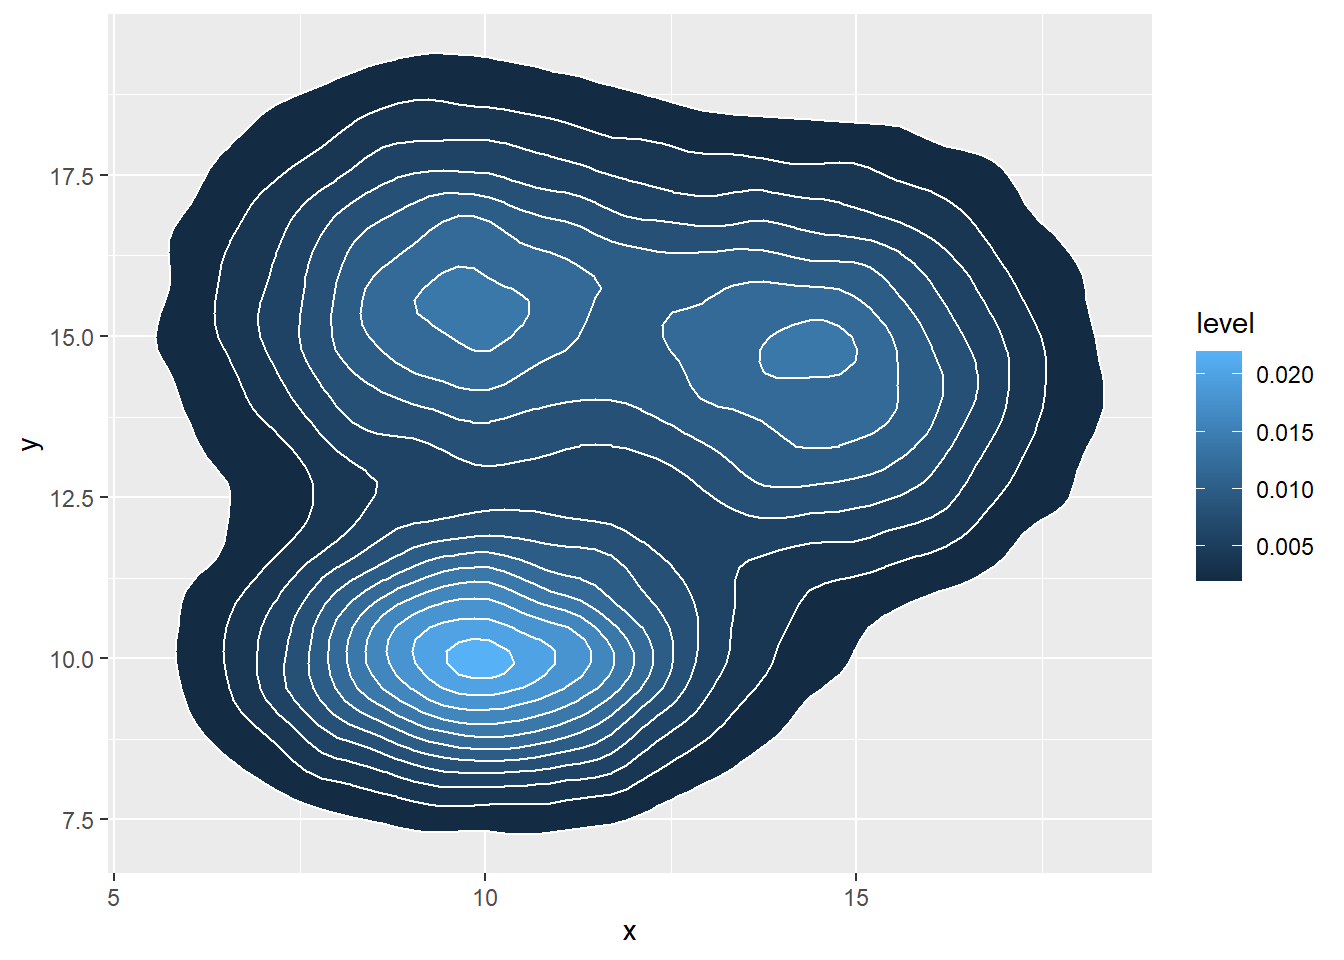
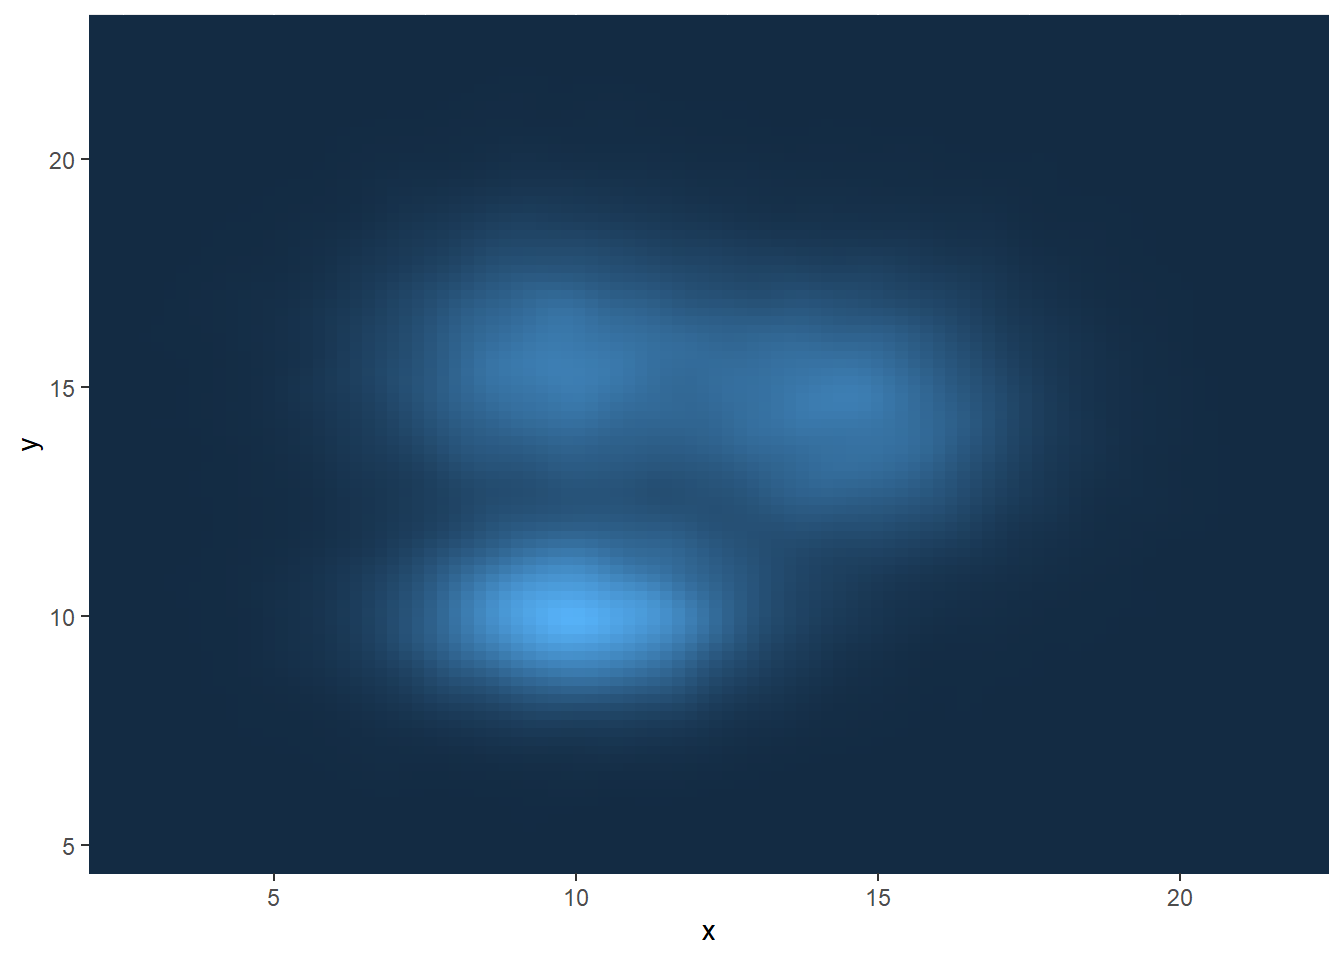
# Using raster
ggplot(data, aes(x=x, y=y) ) +
  stat_density_2d(aes(fill = ..density..), geom = "raster", contour = FALSE) +
  scale_x_continuous(expand = c(0, 0)) +
  scale_y_continuous(expand = c(0, 0)) +
  theme(
    legend.position='none'
  )
Alter the color palette.
You can and should customize the color of your chart regardless of whether you use a 2D histogram, a hexbin chart, or a 2D distribution. The scale fill distiller() method is used in the following recommendation. The ggplot2 portion of the collection contains examples of further techniques.
# Call the palette with a number
ggplot(data, aes(x=x, y=y) ) +
  stat_density_2d(aes(fill = ..density..), geom = "raster", contour = FALSE) +
  scale_fill_distiller(palette=4, direction=-1) +
  scale_x_continuous(expand = c(0, 0)) +
  scale_y_continuous(expand = c(0, 0)) +
  theme(
    legend.position='none'
  )
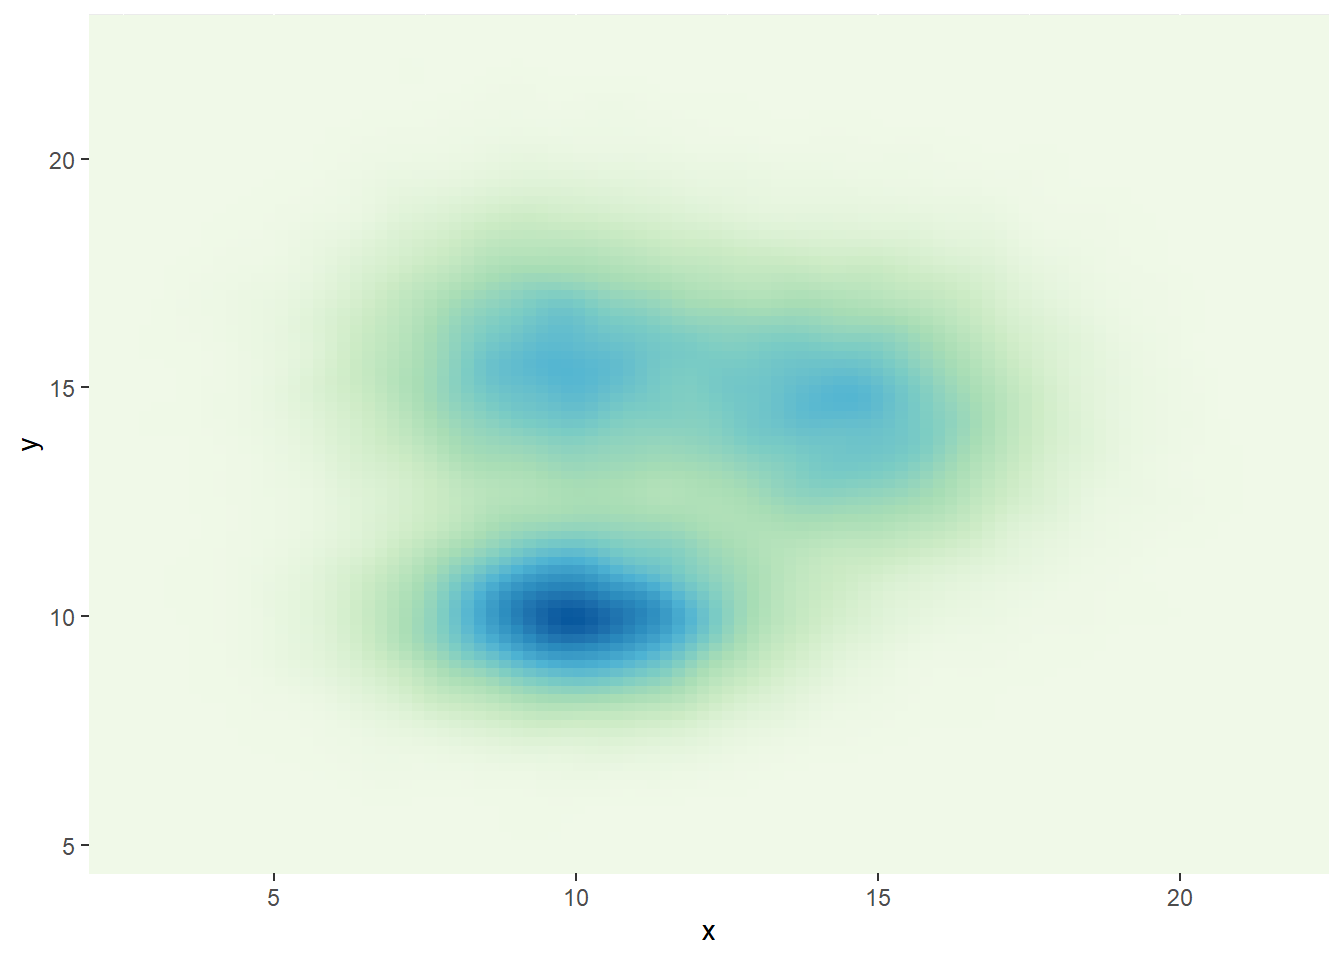
# The direction argument allows to reverse the palette
ggplot(data, aes(x=x, y=y) ) +
  stat_density_2d(aes(fill = ..density..), geom = "raster", contour = FALSE) +
  scale_fill_distiller(palette=4, direction=1) +
  scale_x_continuous(expand = c(0, 0)) +
  scale_y_continuous(expand = c(0, 0)) +
  theme(
    legend.position='none'
  )
# You can also call the palette using a name.
ggplot(data, aes(x=x, y=y) ) +
  stat_density_2d(aes(fill = ..density..), geom = "raster", contour = FALSE) +
  scale_fill_distiller(palette= "Spectral", direction=1) +
  scale_x_continuous(expand = c(0, 0)) +
  scale_y_continuous(expand = c(0, 0)) +
  theme(
    legend.position='none'
  )