Summary report of attending SEU-Allen NRA International Workshop
The primary focus of this meeting is to bring together expert neuroanatomists and computer scientists from different organizations to discuss cutting-edge research and applications on brain-wide reconstructions of neuron morphologies from whole-brain imaging datasets. Specifically, discussions will focus on effective data management, reconstruction workflows and common data quality and format standards for data sharing and reuse of manual, semi-automatic, and fully automatic neuron reconstructions at different organizations and at different resolution scales.
Introduction
The importance of brain science is undeniable, and various international alliances around the world have sprung up brain programs one after another. In 2005, the European Union’s Blue Brain Project (BBP) came out, and in April 2013, the United States announced the launch of the Brain Initiative, and in 2015, Chinese scientists reached a preliminary consensus on the deployment of the One Brain Initiative and the Two Brain Initiative[1]. In response to the international situation, the Allen Institute for Brain Science and Information Studies (AIBIS) at NTU began to convene outstanding laboratories worldwide to reconstruct the whole-brain neural loop, calling for accelerated research on connectomics to advance the brain science research process.
Research basis and research status
At the macroscopic level, magnetic resonance imaging (MRI) is considered the “gold standard” in brain imaging, but it can only achieve general resolution for centimeter-sized tissue samples[2]. At the microscopic level, electron microscope (EM) is a powerful tool for displaying the fine structure of brain tissue with a resolution of up to 1 nm[3]. However, electron microscopy is difficult to perform fine imaging of the whole brain, and it has been estimated that EM whole brain imaging generates an incalculable data set and workload of 10,000 people/year/1 mm3[4]. Optical microscopy, with a resolution between MRI and EM, can observe almost all neuronal protrusions, and there is a wealth of neural labeling techniques applicable to optical imaging, making optical microscopy more applicable and feasible for studying the architecture and connectivity of the intact brain.
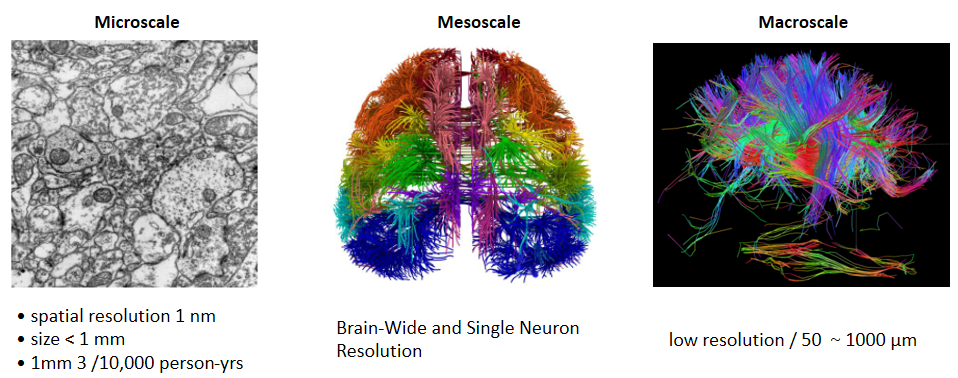 Fig.1. different levels of brain imaging methods [5] [6] [7]
The contradiction between whole brain range level imaging and individual neuronal protrusion level resolution cannot be resolved at present using conventional techniques. In order to solve the problem of incompatible high resolution and large range detection, in recent years, some new neuronal labeling methods, large range optical microscopic imaging methods, and neuronal 3-dimensional reconstruction techniques have been developed by scientists, who have used different strategies to improve labeling highlighting, sparsity, axial resolution, extended imaging depth, and 3-dimensional reconstruction progress. and 3-dimensional reconstruction progress. In this session, these scientists are invited to share and discuss the prospects of neuronal reconstruction techniques and applications.
Conference content summary and analysis
The content of this conference is divided into two main blocks, one is neuronal remodeling technology, and the other is the application of neuronal remodeling technology in brain science research. Neuronal reconstruction techniques include: 1. neuronal dilution labeling techniques; 2. whole brain microscopic imaging aspects; 3. big data processing and visualization of neuronal morphology whole brain reconstruction and public data resources. The applications of neuronal remodeling techniques include: neuronal classification, neural loop tracing and functional imaging.
At the beginning of the session, the session organizer introduced the audience to the core of the workshop by discussing the challenges and opportunities of neuronal remodeling at the whole brain scale. The aim of this workshop is also to bring together scientists working in computational neuroscience and neuromorphology for technical exchange and discussion of scientific issues to advance the field, with the hope that new ideas will collide and bring technical and scientific breakthroughs to the field.
Neuron sparse labeling technique
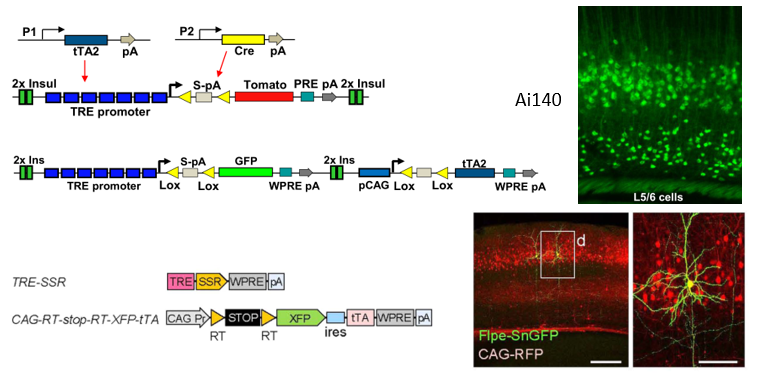 Fig.2 TIGRE system[8] and Supernova sparse tagging system[9]
In recent years, the medical community has proposed the concept of precision medicine, while giving plans for individualized medicine. In the scientific community, precision quantification is also gradually emphasized by scientists, such as single-cell analysis, single-cell sequencing[10], single-cell quantitative biology, and so on. In neuroscience, how can we achieve the study of individual neurons? To face this problem, neuron sparse labeling technique is the best answer. The traditional method of in situ injection of specific fuel through microelectrodes and viral dilution has initially achieved sparse labeling, but it also faces the problems of low efficiency and high surgical difficulty. In recent years, the Allen Institute is utilizing their modified transgenic mice TIGRE1.0 and TIGRE 2.0, etc. to achieve conditional neuronal dilution labeling by crossbreeding between Cre transgenic mice and reporter mice. In this session, Julie Harris of Allen Brain Institute reported the upgrade of TIGRE 1.0 system to 2.0 system (Figure 2-1): TIGRE 1.0 system requires crosses between three types of transgenic mice to achieve dilution labeling, one expressing tTA2 gene, the other expressing Cre gene, and the third with TRE promoter-regulated The TIGRE2.0 system, which turns tTA2 expression into cre protein-dependent, is incorporated into the reporter gene expression system, so that dilution-labeled cells can be obtained by crossing only reporter and cre transgenic mice. On the basis of the dilution labeling of individual neurons on transgenic mice being achieved, they demonstrated whole brain morphological projection reconstruction of neuronal brain regions of interest in combination with fMOST whole brain imaging technology, constructing a whole neuronal information base based on individual neuronal labeling technology, integrating data from RNA-seq, neuronal morphological reconstruction data, and electrophysiological data, and performing more detailed and more detailed and precise neuron classification. This whole system provides powerful technical support for subsequent scientific research at the individual neuron level.
Professor Minmin Luo from NIBS Institute reported another method based on dilution labeling of neurons by virus injection. They adapted and upgraded the Supernova-based sparse labeling system (Figure 2-2) into the BLINCS system, which consists of two viruses, one is a reporter system and the other is a TRE/tTA-based signal amplification system, and the combination of the two allows for a tunable neuronal sparse labeling technique. Due to the operability and convenience of the viruses, the sparse labeling system enables single-cell labeling of specific neuron types, and its high signal-to-noise signal is also suitable for subsequent whole-brain imaging techniques such as light-sheet and fMOST. On the basis of the technology, Prof. Minmin Luo’s lab has completed the whole-brain-wide neuronal morphological reconstruction at the level of single neurons of multiple nuclei including DRN, and constructed single-neuron level connectomics, which has greatly improved the research level of neural loop connectomics and promoted the development of the field.
Whole brain microscopic imaging
Fluorescence microscopic optical section tomography (fMOST)
In this meeting, Prof. Xiangning Li from Wuhan National Laboratory of Optoelectronics, Huazhong University of Science and Technology, as the HUST-MOST team, gave us an introduction to their whole brain imaging technology-microscopic optical section tomography of whole brain neural connections (MOST/fMOST)[11,12]. The aim of developing this imaging system is to acquire complete brain data at the level of protrusions (submicron resolution) with high throughput.
The MOST series systems were designed with four main specifications: 1) lateral resolution close to the limit resolution of optical systems and axial resolution level of 1 m. 2) Ability to perform complete 3D imaging of samples larger than 3 cm in size with no data loss. 3) Acquired data with natural image alignment properties. 4) Ability to acquire data in a fully automated manner and the system can work continuously and stably for a long time (24 hours/day, more than 1 month continuously).
Light sheet illumination microscopic imaging (Light Sheet)
The advantage of light sheet illumination microscopy is the use of a surface-detection imaging method, thus enabling rapid acquisition of high-resolution 3D laminar structure imaging. the fast imaging characteristics of the light sheet microscopy system combined with the available high-speed imaging devices allow the system to reach imaging speeds of more than 40 frames per second, which provides an effective method to achieve rapid neural dynamic imaging. Dr. Arun from CSHL-Osten lab presented his latest research progress on OLST[13], an optimized optical slice illumination microtomography technique. Prof. Guoqiang Bi from CSHL presented their development of a high-speed whole brain imaging system, VISoR[14], which is also an improved technique based on the Light sheet imaging technique.
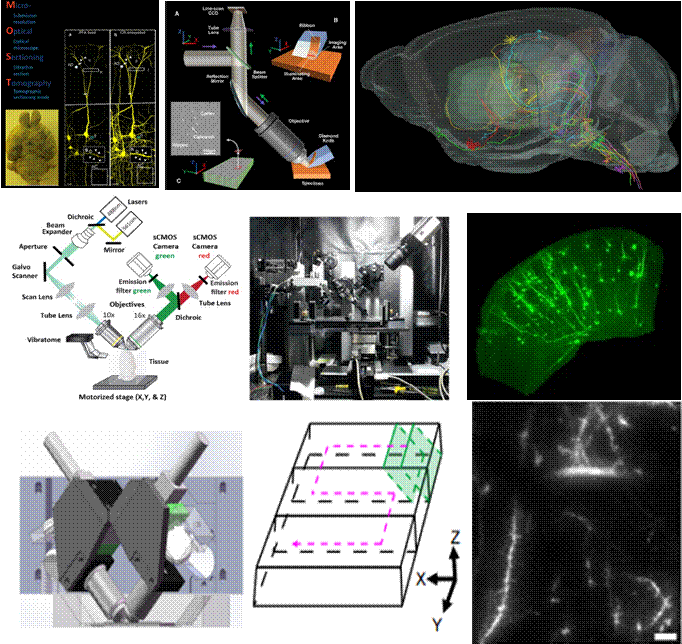 Fig.3 fMOST and light sheet imaging techniques [12][13][14]
-
fMOST (fluorescence micro-optical slice tomography); left: mouse brain sample, labeled imaging image; middle: fMOST schematic; right: neuronal projection reconstruction results[12];
-
OLST (Oblique Light Sheet Tomography) tilted light sheet tomography; left: OLST imaging schematic; middle: physical view of equipment build (Volumetric imaging with synchronized on-the-fly-oblique-scan and readout); left: principle diagram of VISoR imaging; middle: diagram of synchronized on-the-fly-oblique-scan and readout; right: diagram of OLST imaging results combined with sparse labeling[13];
-
readout mode diagram; right: imaging result diagram.[14]
The imaging systems of OLST and VISoR are similar in that the objective consists of an illumination objective and a detection objective, both at an angle of 45° to each other.The sampling point of VISoR can be controlled at 0.49 x 0.49 x 3.5um3 and the imaging speed can reach 2 hours to scan the whole brain. The OLST has a controlled sampling size of 0.75 x 0.75 x 2.5µm3 and a speed of about 14hs for a whole brain scan, with a high signal-to-noise ratio and high resolution, especially for dendritic morphological reconstruction and long-range projection tracing of individual neurons. In contrast, VISoR is more suitable for imaging genetically labeled, chemically labeled, and antibody-labeled neurons. In contrast, VISoR is more suitable for high-speed imaging, imaging of large samples (primate brains are several times larger than rodent brains), high-throughput whole brain reconstruction, and high-throughput morphological identification of pathology.
2.3 Morphological reconstruction of the whole brain extent of neurons
Being able to image at high speed is not enough, the next problem is how to extract the 3D structure from the massive amount of 2D microscopic images. The larger the sample, the higher the resolution, and the larger the amount of data, and the MOST/light sheet dataset poses two important challenges for computer software. The first is the massive data problem. When MOST or Light sheet imaging sample point size is controlled at 0.5µm x 0.5µm x 2µm, the data volume of a complete set of mouse brain is at least 3T, a complete set of rat brain reaches 10TB or more, and the data volume of primate brain will reach 100TB. ~100GB, the difficulty of processing MOST dataset is huge. Another challenge for the software is the complexity of the data. The huge number of blood vessels, neurons, fiber tracts, and glial cells in the brain with different densities and morphologies, and the different optical labeling methods used corresponding to different research questions, all pose great difficulties for computer-based identification, extraction, and analysis of various microstructures. Therefore, neither the use of existing general-purpose software platforms (e.g., Amira, ImageJ, Gtree (Figure 4-A)), nor dedicated software packages for other microscopy products can be directly used to process and analyze these massive data sets. One of the conference organizers, researcher Hanchuan Peng, developed the Vaa3D technology[15] a few years ago, which is suitable for visualization and processing of big data biomedical images, in addition to the neuroglancer software developed by google, which has made a great contribution to the 3-dimensional reconstruction of electron microscopy images.
Vaa3D(V3D) is a Qt-based open source biomedical image visualization software platform that can be used for regular 2D, 3D, 4D image visualization. Its main advantageous features are: it can achieve a very large memory image data set (GB size or more) processing; through the mouse real-time 3D space selection, labeling, measurement of any three positions in the image, without virtualization display or other complex and expensive equipment; software code is completely open source and so on.
In neuroinformatics, how to accurately image and morphology reconstruct neuronal cells in 3-dimensional space has been a popular research problem in the field. Vaa3D provides a perfect solution to the problem of how to handle and visualize the 3-dimensional neuronal morphology when different ranges of whole brain imaging methods have been introduced to obtain the imaging data in 2-dimensional space. In addition, researchers at the Allen Institute of Southeast University have also developed Vaa3D-VR technology combined with virtual reality technology and applied it to the study of neuronal morphology reconstruction and tracking. vaa3D-VR technology directly visualizes the work of neuronal reconstruction and tracking, allowing neuronal reconstruction workers to directly immerse themselves in the neuronal reconstruction, increasing the reconstruction accuracy and also reduces the technical requirements of neuronal reconstruction work, making it possible to spread this technology and allow the general public to participate in neuronal reconstruction work, and even industrialize neuronal reconstruction.
Google’s Dr. Maitin introduced us to neuroglancer, Google’s newly developed open source platform for web-based data storage and visualization, which demonstrates a novel recurrent neural network that can improve the accuracy of automatic interpretation of connected histology data by an order of magnitude compared to previous deep learning techniques for large-scale connected histological datasets. In image processing, they used the Flood-Filling network for 3D image segmentation[16]. In the field of neuronal reconstruction, the application of electron microscopy imaging to reconstruct neurons encounters the typical image segmentation problem: how to track neuronal structures in large-scale electron microscopy data? Traditional algorithms divide the process into at least two steps: firstly, finding the boundaries between neurosynapses using edge detectors or machine learning classifiers, and secondly, combining image pixels that are not separated by boundaries using algorithms such as watershed or graphical cuts.Since 2015, researchers have started to experiment with alternative approaches based on recurrent neural networks, and the Flood-filling network is based on this idea, which unifies these two steps. The algorithm is embedded at a specific pixel location and then iteratively “fills” a region using a recurrent convolutional neural network that predicts which pixels are part of the same object as the seed.[22]
Finally Dr. Maitin spoke about Google’s continued refinement of connectome reconstruction techniques to fully automate the synaptic resolution connectivity component, and to help the larger research community develop connectomics techniques, Google has open-sourced the TensorFlow code for the blood-filling network approach, as well as the WebGL visualization software for WebGL visualization software for 3D datasets , which can help understand and improve reconstruction results.
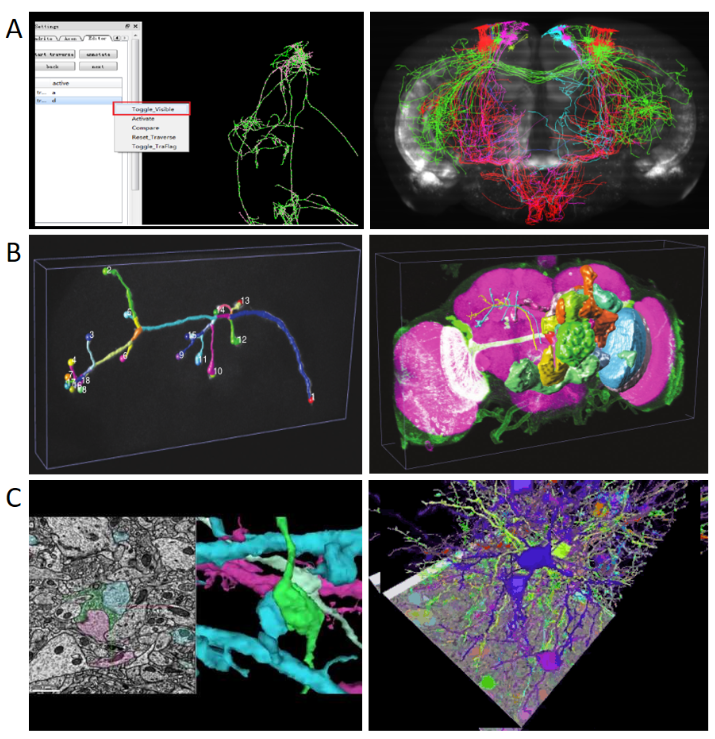 Fig.4 Morphological reconstruction of the whole brain extent of neurons
A. Reconstruction and visualization of fMOST imaging results using Neurotree software[17];
B. Left: Reconstruction and visualization of Drosophila neurons using Vaa3D software[15]; Right: Reconstruction and visualization of the whole brain of Drosophila using Vaa3D software[15];
C. Google’s Neuroglancer software demonstration[16]; Left : Reconstruction and visualization of electron microscopic imaging results of synaptic connections; Reconstruction and visualization of a neural network.
In addition, on the computational side, Professor Hill, a representative of BBP EU Blue Brain Project, demonstrated their process and structure of whole brain neuron simulation technique. Mr. Lijuan Liu from Allen Institute of Southeast University summarized the process of whole brain-wide neuronal remodeling and gave 4 levels of remodeling criteria including cytosol, axon, and dendritic position.
Application of neuronal whole-brain morphological reconstruction techniques
Classification of neurons
Traditional neuronal classification is relatively crude and can only distinguish between a large range of neurons with typically different nuclei. Nowadays, the scientific community has resolved many different molecular marker genes that can be used directly by transgenic methods combined with sparse labeling techniques to label and perform projection tracking and morphological reconstruction of neuronal cells to classify neurons more precisely in terms of projection specificity and morphological specificity. The classification of neurons based on integrated classification is no longer based only on the qualitative description and subjective assessment of microscopic images.
With advances in imaging, sequencing, and automated analysis algorithms, more detailed quantitative data will become available for classification. In this session, Harris researchers from the Allen Institute shared their group’s findings on the classification of mouse cortical neurons by morphological reconstruction (Figure 5-1) and transcriptome sequencing analysis[18][19].
Precise tracing of neural loops
Previously, conventional neural loop tracing techniques applied prograde trans-unitary, trans-multilevel, and retrograde trans-unitary, trans-multilevel tool viruses to label neurons with single nucleus cluster infections, and then explored upstream and downstream of the loop by sectioning, fluorescence imaging, or staining. The traditional point-to-point approach ignores the information during the neural loop projection, however, the whole brain-wide reconstruction of neuronal morphology can fully resolve the detailed information during the input-output projection of the neural loop. The research results of their research group, namely, the morphological projection characteristics of L6-Car3 type neurons, were presented by Yun Wang of the Allen Institute, which is an important contribution to the study of brain connectomics and the projection of individual neurons.
Functional imaging of neurons
Structure and function complement each other, and the combination of virus-assisted labeling of neuronal activity reporter genes with whole-brain microscopic imaging allows one to rapidly obtain information on neuronal activity at the whole-brain level, as was achieved by the Keller lab in 13 years for whole-brain imaging of intact zebrafish brains at the single-cell level[20]. They used GcaMP5G as a neuronal activity reporter gene, and combined with light sheet imaging technology could complete the scanning of whole brain neuronal activity in 1.3s. In this conference, Guoqiang Bi from the University of Science and Technology of China demonstrated that he used his self-developed light sheet imaging technology ViSoR combined with the cfos-GFP neuronal activity reporter system to perform functional imaging at the level of individual neurons in the whole brain of mice after certain environmental stress treatments, and recorded the differences in the responses of different brain regions to different environmental stress treatments.
In addition, Franck’s group at Columbia University showed that they constructed a whole-cell synaptic map of L2/3 pyramidal neurons by statistical analysis after morphological reconstruction of individual neurons, and then based on this they performed a functional study of activation and inhibition homeostasis. They used the open source software of Spine Detector within Vaa3D in their study to outline the E/I synapses of the whole neuron. It can be seen that Vaa3D is useful for functional studies in addition to neuronal morphological reconstructions.
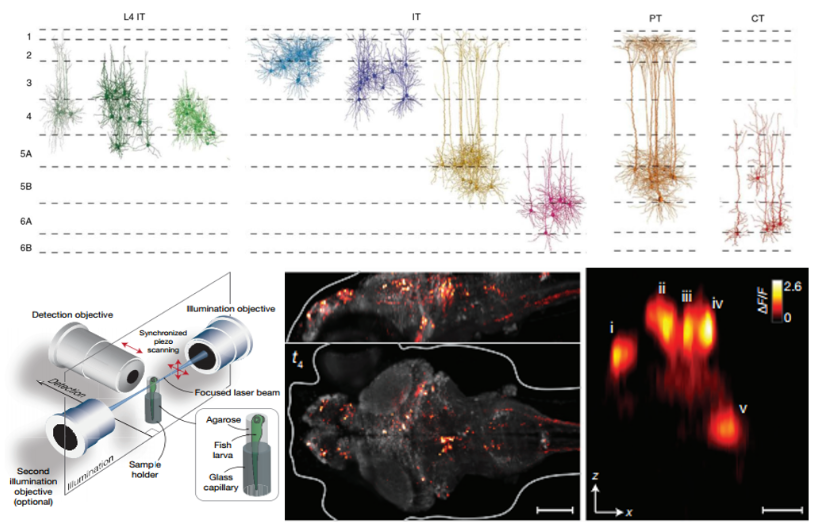 Fig.5 Application of neuronal whole brain morphological reconstruction technique
- morphological classification of excitatory neurons in cortical loops[19];
- left: schematic diagram of Light sheet imaging; right: diagram of GcaMP5G functional imaging results[20].
Harvest summary
During the conference tea, I took the opportunity to discuss with many scientists about the frontier of neuronal remodeling, including: discussing TIGER2.0 with Harris from Allen Institute, she said that the main progress from 1.0 to 2.0 is that it no longer requires multiple mouse crosses, but only one Cre driver and then one generation of crosses with the Reporter mouse line. She discussed with Prof. Francisco about corticothalamic projection loops and neuronal classification, and Prof. Guoqiang Bi about the advantages of lightsheet imaging and its integration for functional imaging, as well as the application of functional projection loop reconstruction from the central to the peripheral nervous system. During the dinner, we also discussed with students from other labs in China, and found that students who attended the meeting had backgrounds in electron microscopy reconstruction, MRI, etc. The discussion was very beneficial. My impression is that the intersection of different techniques always leads to some sparks that can solve unsolved problems in existing fields or can extract more information.
In the afternoon of the second day of the conference, we also visited the Southeast University of Nanjing-Allen Joint Institute for Neural Computation, during which they demonstrated the work of the whole Neuronal Reconstruction Computing Research Group, as well as the interesting Vaa3D-VR technology, and many visiting academic partners experienced neuronal reconstruction through Vaa3D-VR technology themselves. I also had the opportunity to experience it. Since I had previously learned about neuronal morphology reconstruction on conventional 2 dimensions, in comparison, I could experience the neuronal morphology more realistically in the VR world and reconstruct the neuronal morphology more visually. The whole vision was very shocking to me and gave me a sense of reverence for computational science.
To keep up with the international pace, Beijing Brain Science Center also actively participated in the conference. 6 student representatives from the first session of the Center attended the academic conference, and the director of the Northern Center, Researcher Minmin Luo, gave a keynote speech in the conference. I benefited from the international symposium, which greatly expanded my research horizon and inspired me to continue my efforts.
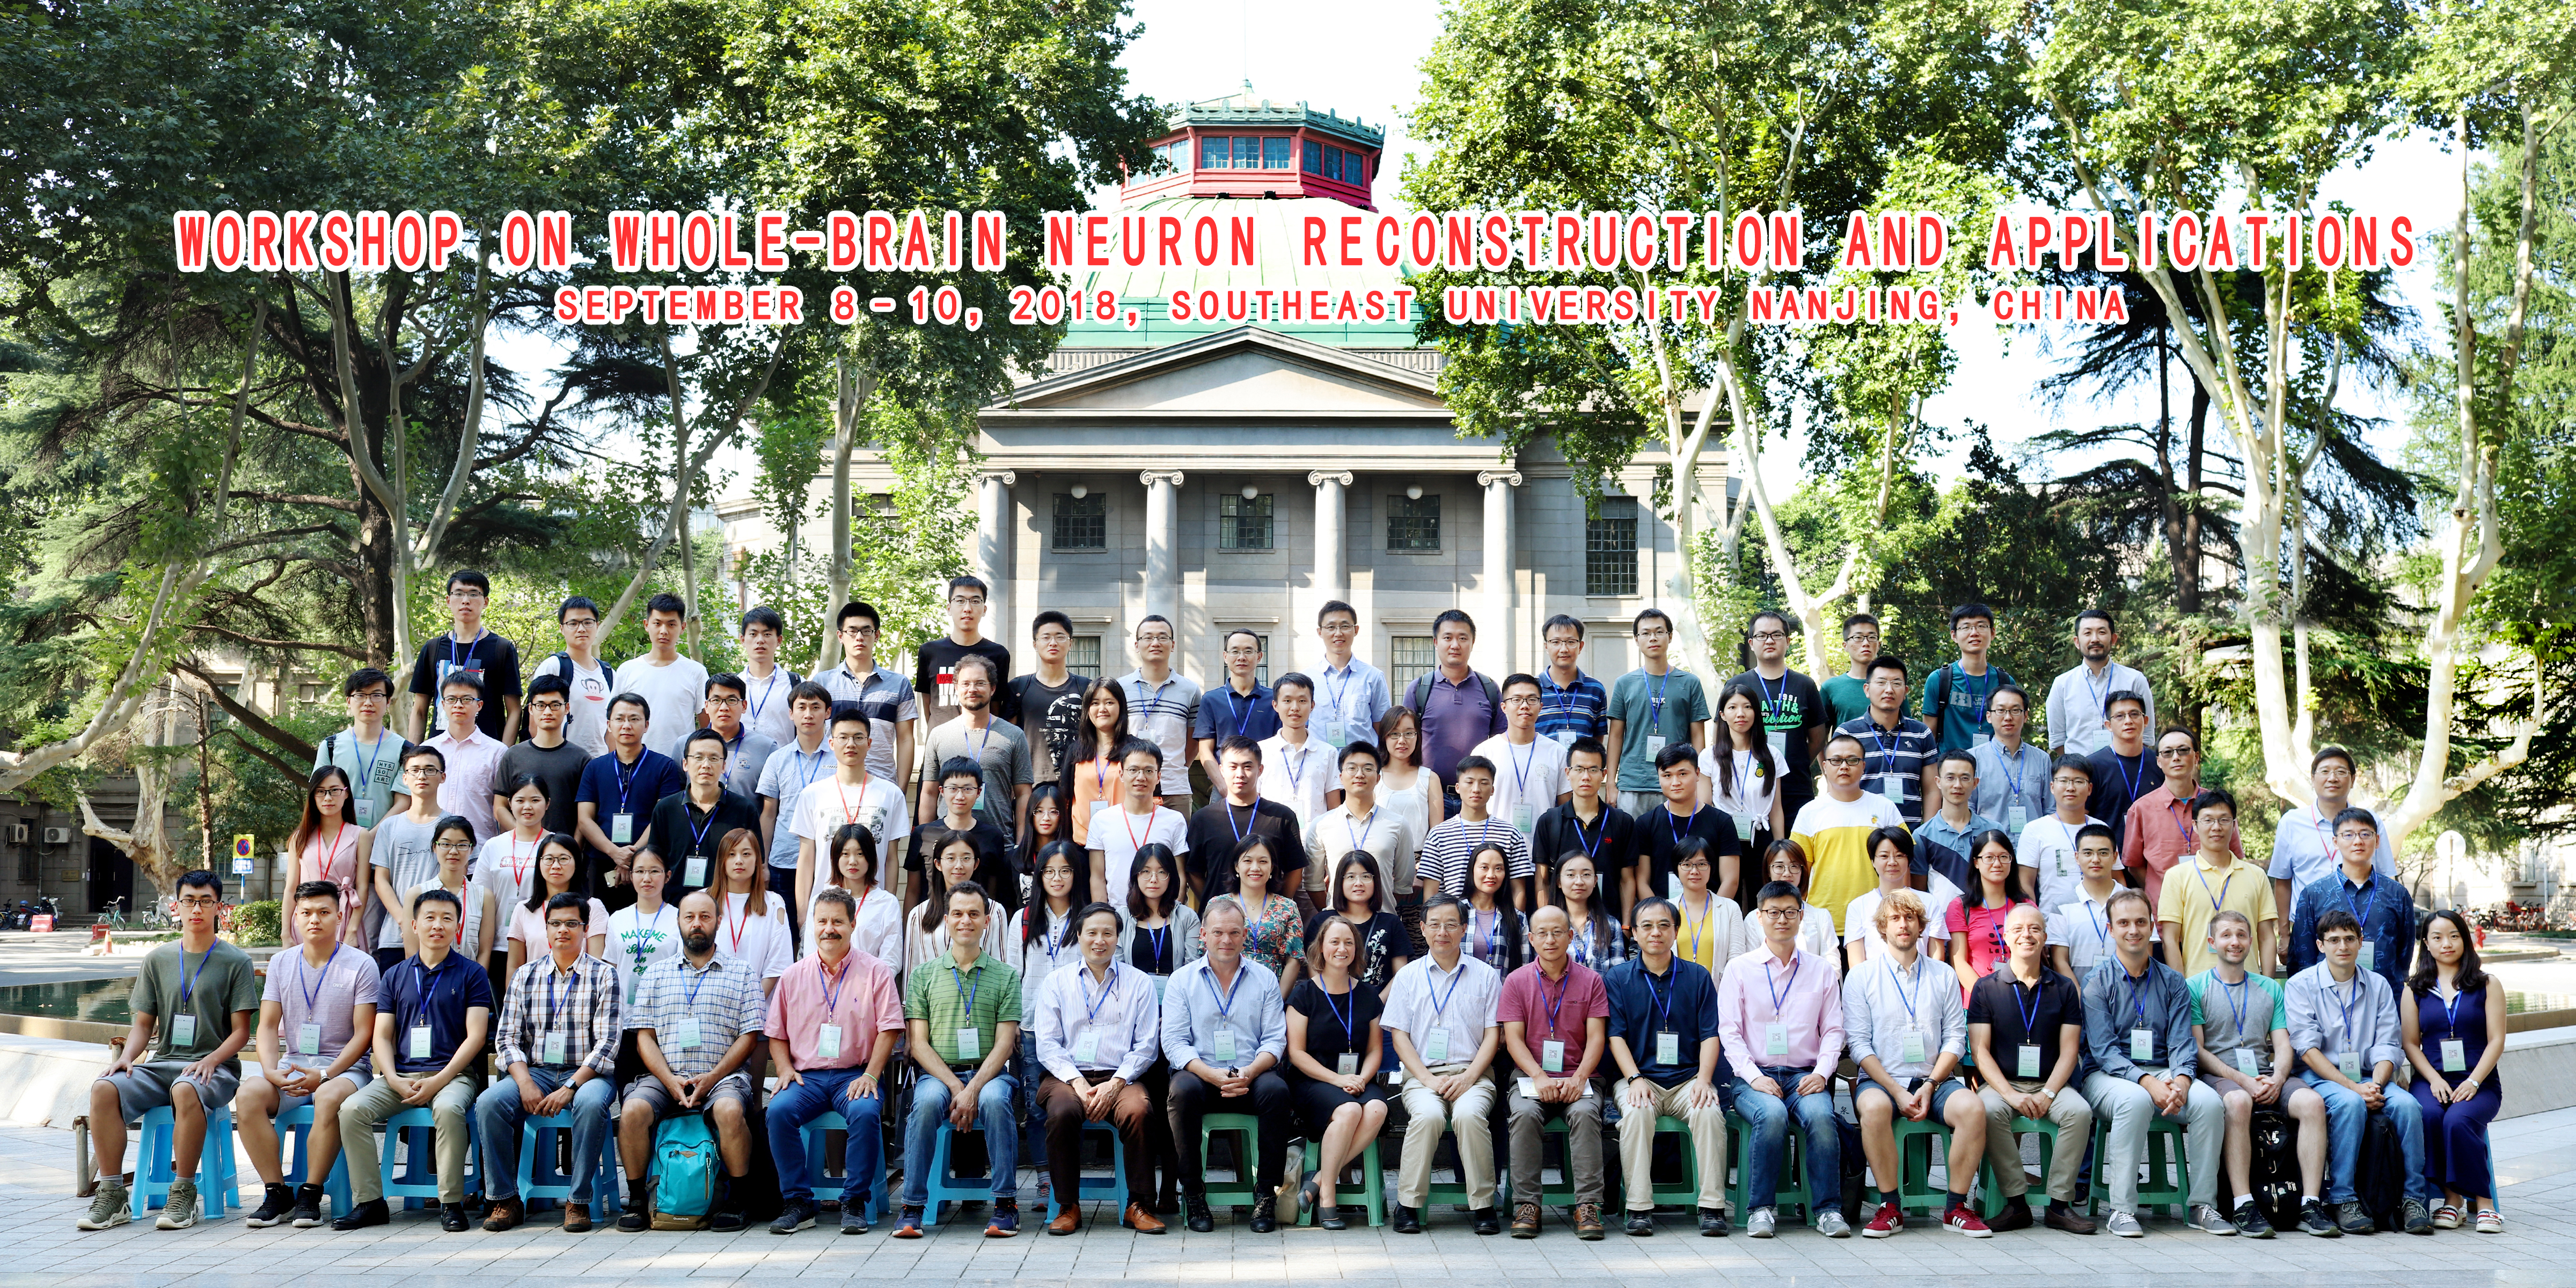
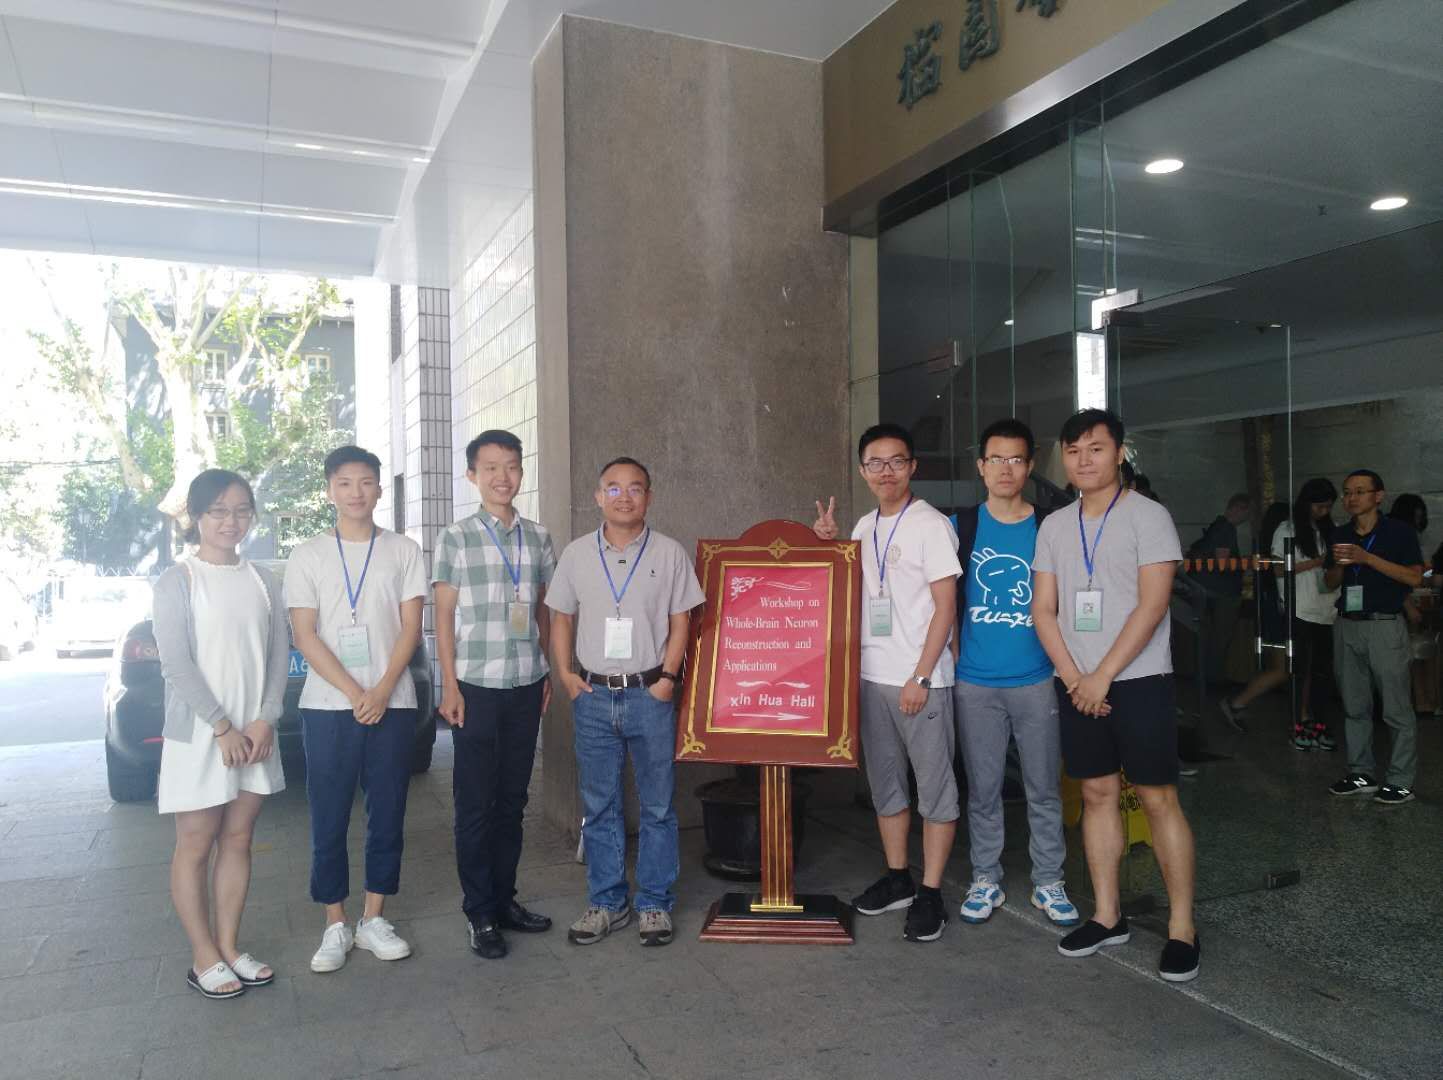
Workshop organizers
Giorgio Ascoli (George Mason University, USA)
Sean Hill (University of Toronto, Canada)
Hanchuan Peng (Allen Institute, USA)
Workshop official website
https://braintell.org/seu-allen/nra2018/
References and Related Resources
-
李安安, and 龚辉. “光学显微水平全脑成像方法的研究进展."Progress in Biochemistry and Biophysics 39.6 (2012): 498-504.
-
Sosinsky, G. E., et al. (2007). “Markers for correlated light and electron microscopy.” Methods Cell Biol 79: 575-591.
-
Luo, L., et al. (2008). “Genetic dissection of neural circuits.” Neuron 57(5): 634-660.
-
Google picture
-
ALLENINSTITUTE.ORG
-
Human Connectome Project
-
Daigle, Tanya L., et al. “A suite of transgenic driver and reporter mouse lines with enhanced brain cell type targeting and functionality.” (2018).
-
Luo, Wenshu, et al. “Supernova: a versatile vector system for single-cell labeling and gene function Studies in vivo."Scientific reports 6 (2016): 35747.
-
Tang, Fuchou, et al. “mRNA-Seq whole-transcriptome analysis of a single cell.” Nature methods 6.5 (2009): 377.
-
Anan Li. et al. Micro-optical sectioning tomography to obtain a high-resolution atlas of the mouse brain, SCIENCE, 330, 1404-1408 (2010).
-
Hui Gong. et al. Continuously tracing brain-wide long-distance axonal projections in mice at a one-micron voxel resolution, NeuroImage, 74, 87-98 (2013)
-
Narasimhan, A., et al. “Oblique light-sheet tomography: fast and high resolution volumetric imaging of mouse brains.” (2017).
-
Wang, Hao, et al. “Scalable volumetric imaging for ultrahigh-speed brain mapping at synaptic resolution.” bioRxiv (2017): 240770.
-
Peng, Hanchuan, et al. “V3D enables real-time 3D visualization and quantitative analysis of large-scale biological image data sets.” Nature biotechnology 28.4 (2010): 348.
-
Januszewski, Michał, et al. “High-precision automated reconstruction of neurons with flood-filling networks.” Nature methods 15.8 (2018): 605.
-
fMOST Lab07-Neuron Tracing, CSHA summer course on Building and Mining Brain Cell Atlases and Connectomes, June 25-July 11, 2018, Suzhou, China
-
Harris, Julie A., et al. “The organization of intracortical connections by layer and cell class in the mouse brain."bioRxiv (2018): 292961.
-
Harris, Kenneth D., and Gordon MG Shepherd. “The neocortical circuit: themes and variations.” Nature neuroscience 18.2 (2015): 170.
-
Ahrens, Misha B., et al. “Whole-brain functional imaging at cellular resolution using light-sheet microscopy.” Nature methods 10.5 (2013): 413.
-
SEU-Allen NRA Meeting materials, 2018.
-
https://braintell.org/seu-allen/nra2018/09_workshop_title_abs_simple.pdf
Related Websites:
-
iConnectome (www.MouseConnectome.org)
Systematically Characterize neuronal connectivity of distinct neuronal populations, defined as nuclei, areas, regions, or cell groups in the brain, at neuronal network level. -
A data management platform Blue Brain Nexus(https://github.com/BlueBrain/nexus)(EPFL)
-
NYU-buzsaki lab home page dataset:http://buzsakilab.com/wp/datasets/
